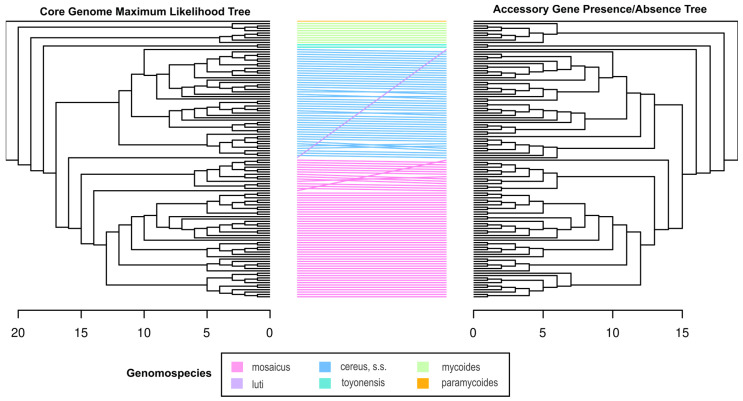
Figure 5.
Tanglegram comparing the core genome phylogeny and accessory gene presence/absence tree. The colors of the lines connecting the tree leaves represent the genomospecies classification of each clade according to the 2020 genomospecies classification scheme for the B. cereus group [81] as guided by the core genome phylogeny and the distribution of type strains. The scale bars indicate the height of each tree (the largest number of edges between the tree leaves and the root). While there is entanglement within the genomospecies clades, there is no entanglement between clades, indicating the accessory gene presence/absence tree largely recapitulates the topology of the core genome phylogeny.

