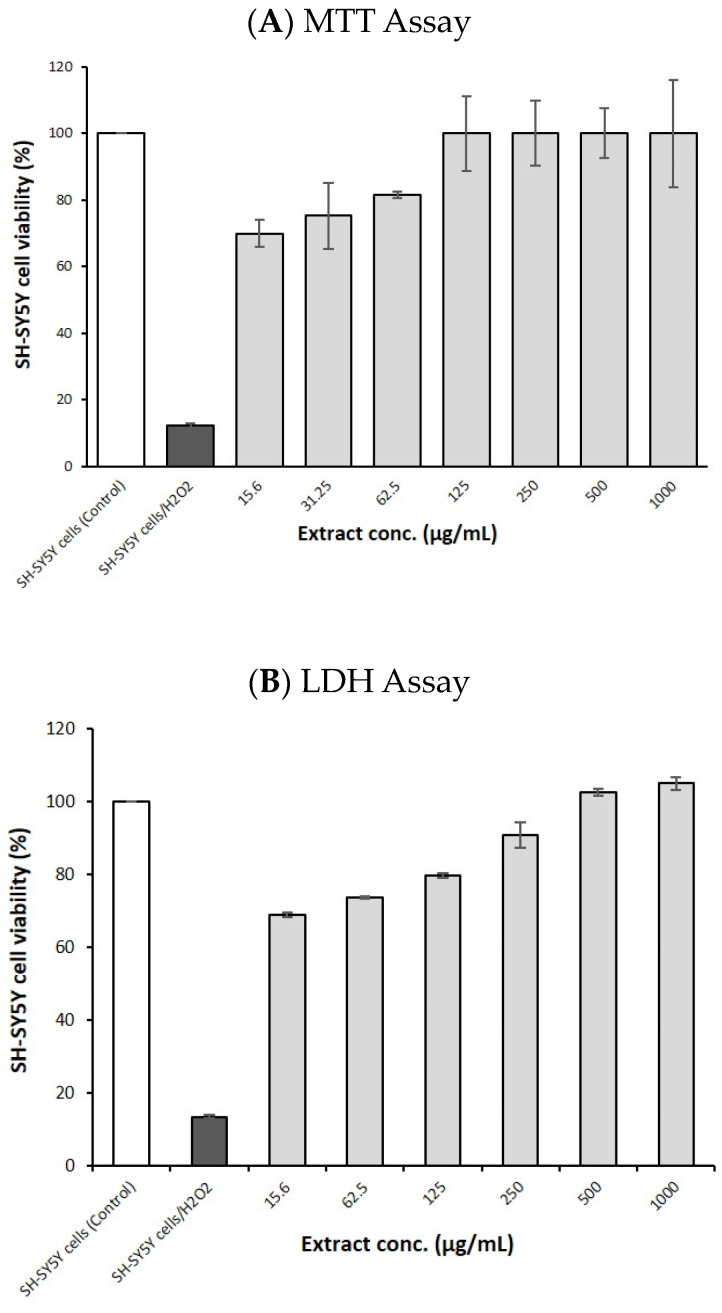
Figure 5.
The neuroprotective effect of GSEe on SH-SY5Y cells under oxidative stress induced by H2O2. The plots show the effects of various concentrations of GSEe on SH-SY5Y cell viability. (A) MTT assay. (B) LDH assay. The error bars represent the standard deviation from the mean of the measurements of three freshly prepared samples.

