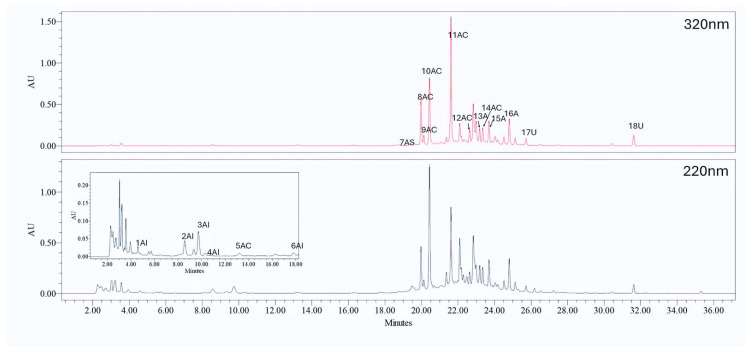
Figure 1.
Chromatogram obtained from the HPLC analysis of the chamomile extract. The figure shows the chromatogram extracted at two different wavelengths, 220 nm (bottom panel) and 320 nm (top panel). The inset in the bottom panel provides a detailed view of the peaks in the early elution times. The peaks are labeled with abbreviations corresponding to the DOE response vectors, where AI stands for hydroxybenzoic acids, AC for hydroxycinnamic acids, and A for apigenin derivatives.

