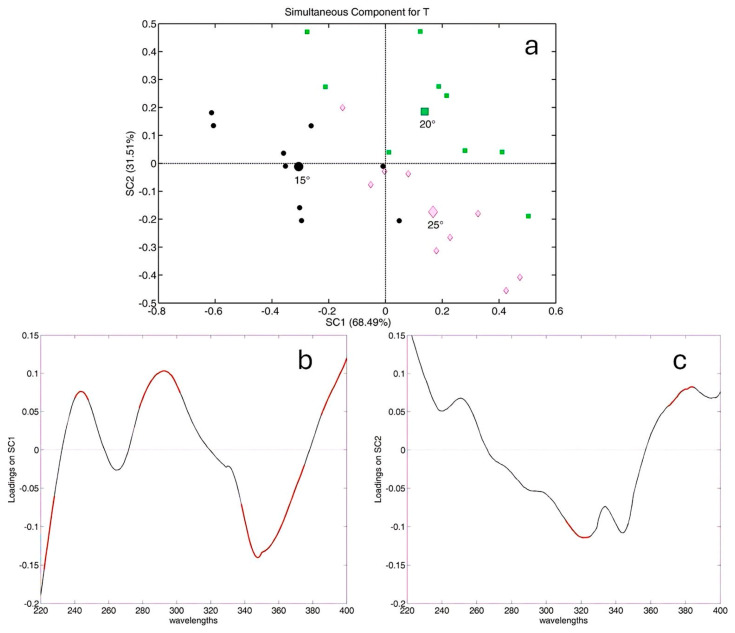
Figure 5.
ASCA outcome for temperature: (a) score plot for the temperature factor; all symbols are differentiated according to the levels (15 °C, 20 °C, and 25 °C) of the extraction temperature. Spectroscopic variables significantly influenced by temperature are highlighted in red on the loading profile for the loading plot on SC1 (b) and SC2 (c).

