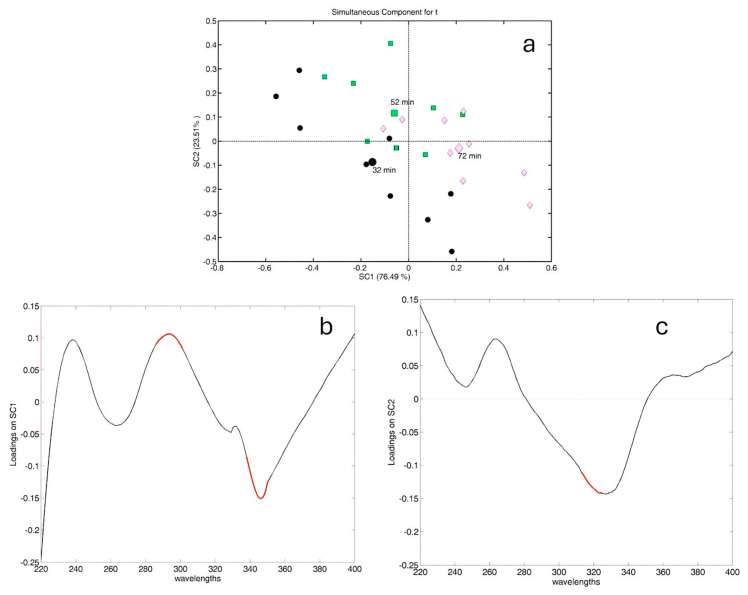
Figure 6.
ASCA outcome for the time factor: (a) score plot for the time factor; all symbols are differentiated according to the different levels (32 min, 52 min, 72 min) of extraction time. Spectroscopic variables significantly influenced by time are highlighted in red on the loading profile for the loading plot on SC1 (b) and SC2 (c).

