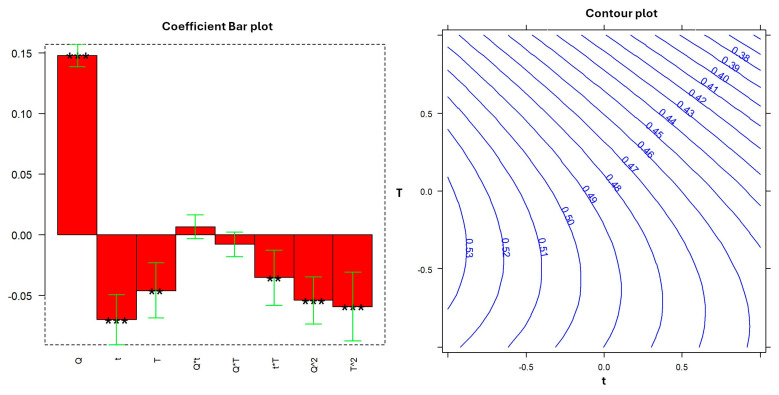
Figure 7.
Coefficient bar plot and contour plot related to the DOE empirical model. The bar plot shows the magnitude and the correlation (positive or negative) of the coefficients with respect to the response (). The brackets represent the confidence intervals at p = 0.05, and the stars indicate the significance of the coefficients (** = p < 0.01, *** = p < 0.001). The trend of the predicted response in the experimental domain is reported in the contour plot related to the maximum level of quantity (2.5 g).

