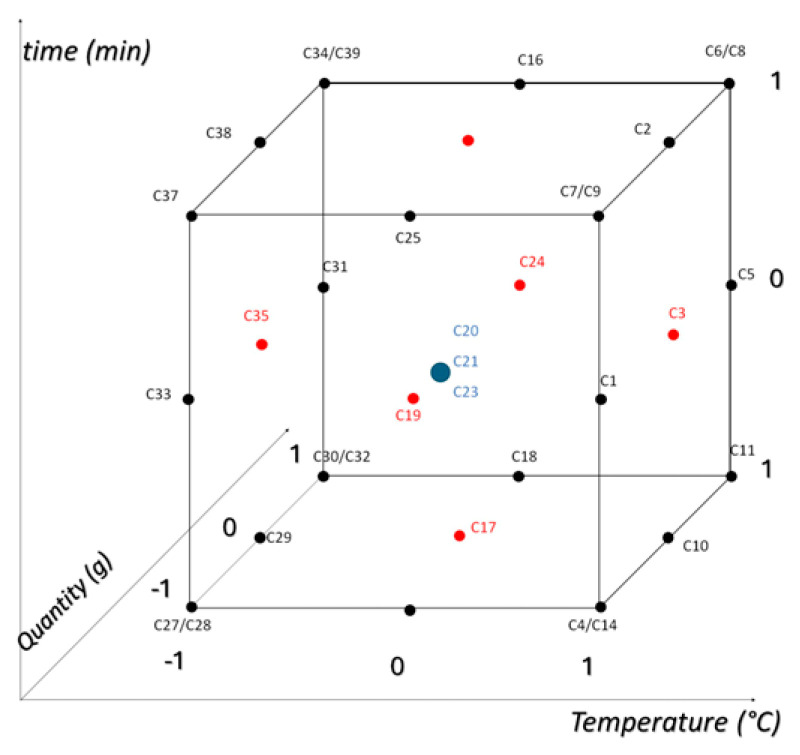
Figure 8.
Explored experimental domain, sample names, and relative scaled levels. The different colors represent the central point (in blue) and the points at the center of each face of the cube (red). This color differentiation helps visualize the experimental design and understand the spatial arrangement of the samples within the experimental domain.

