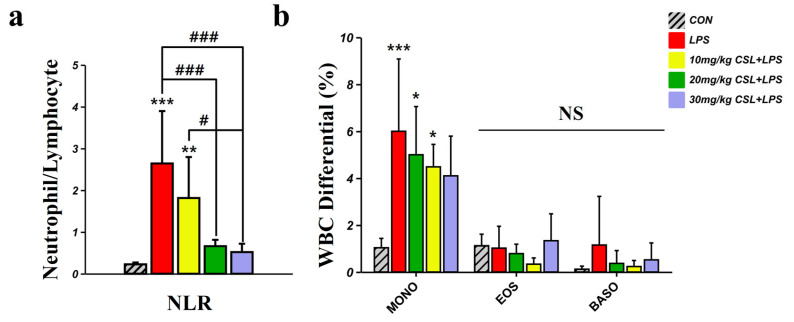
Figure 3.
Hematological inflammatory markers following CSL administration in the LPS model. (a) Neutrophil to lymphocyte ratio (NLR), (b) monocytes (MONO), eosinophils (EOS), and basophils (BASO). Results are expressed as mean ± standard deviation (S.D.). One-way ANOVA followed by Tukey’s post hoc test. *, compared with the CON group; #, compared between the groups; NS, not significant. */#, p < 0.05; **, p < 0.01; ***/###, p < 0.001. (n = 6 per group).

