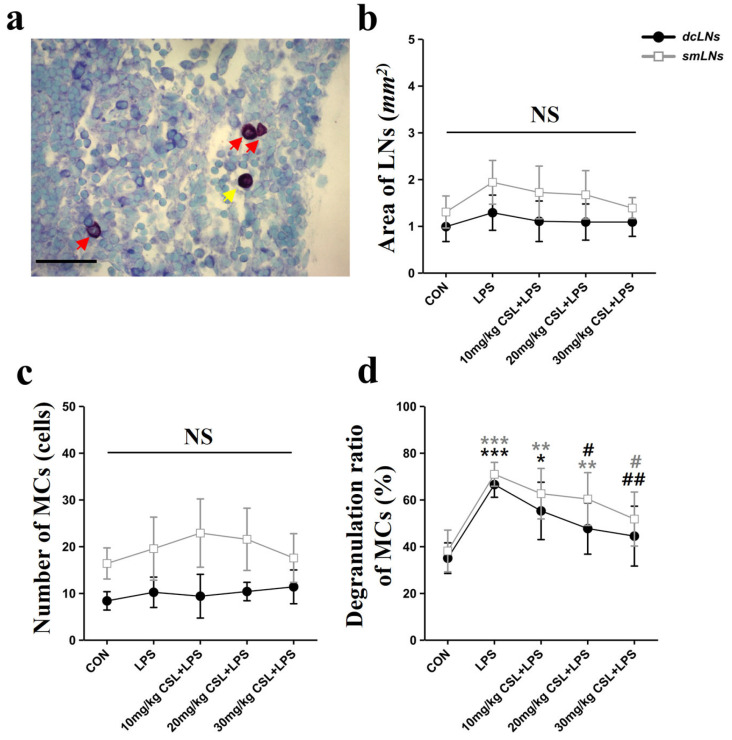
Figure 4.
Effects of CSL on mast cell (MC) activation in deep cervical lymph nodes (dcLNs) and submandibular lymph nodes (smLNs) in the LPS model. (a) Representative LN image showing mast cell degranulation (red arrows: degranulated MCs, yellow arrow: non-degranulated MCs, scale bar: 100 µm), (b) area of LNs, (c) number of MCs, (d) degranulation ratio of MCs. Results are expressed as mean ± standard deviation (S.D.). One-way ANOVA followed by Tukey’s post hoc test. *, compared with the CON group; #, compared with the LPS group; NS, not significant. */#, p < 0.05; **/##, p < 0.01; ***, p < 0.001. (n = 6 per group).

