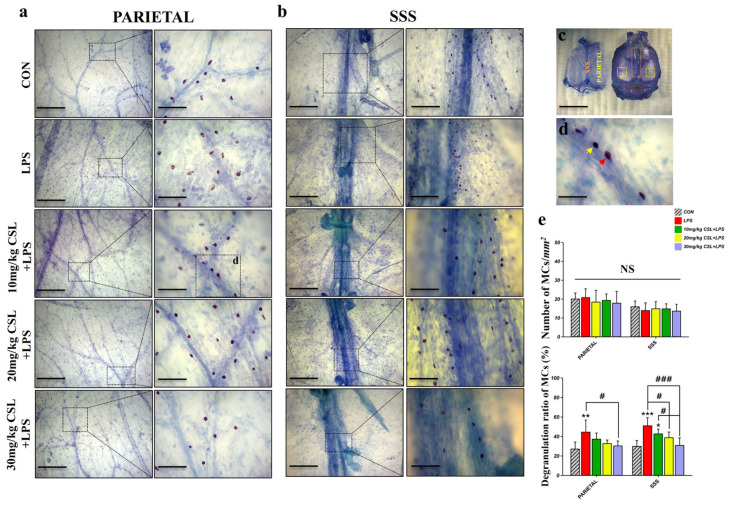
Figure 5.
Effects of CSL on mast cell (MC) activation in the dura mater of the LPS model. (a) Representative images of MCs in the parietal region and (b) in the superior sagittal sinus (SSS) region. The right side of each image is a magnified view of the area highlighted by the dashed box. Scale bar: (a) left: 1 mm, right: 200 µm; (b) left: 1 mm, right (CON and LPS groups): 400 µm, (CSL groups): 200 µm. (c) Dura mater separated from the skull, with the parietal region marked by a yellow dashed box and the SSS region by an orange dashed box. Scale bar: 10 mm. (d) Representative image of MCs in the dura mater (red arrow: degranulated MCs, yellow arrow: non-degranulated MCs, scale bar: 100 µm). (e) Number of MCs/mm2, and degranulation ratio of MCs. Results are expressed as mean ± standard deviation (S.D.). One-way ANOVA followed by Tukey’s post hoc test. *, compared with the CON group; #, compared between the groups; NS, not significant. */#, p < 0.05; **, p < 0.01; ***/###, p < 0.001. (n = 6 per group).

