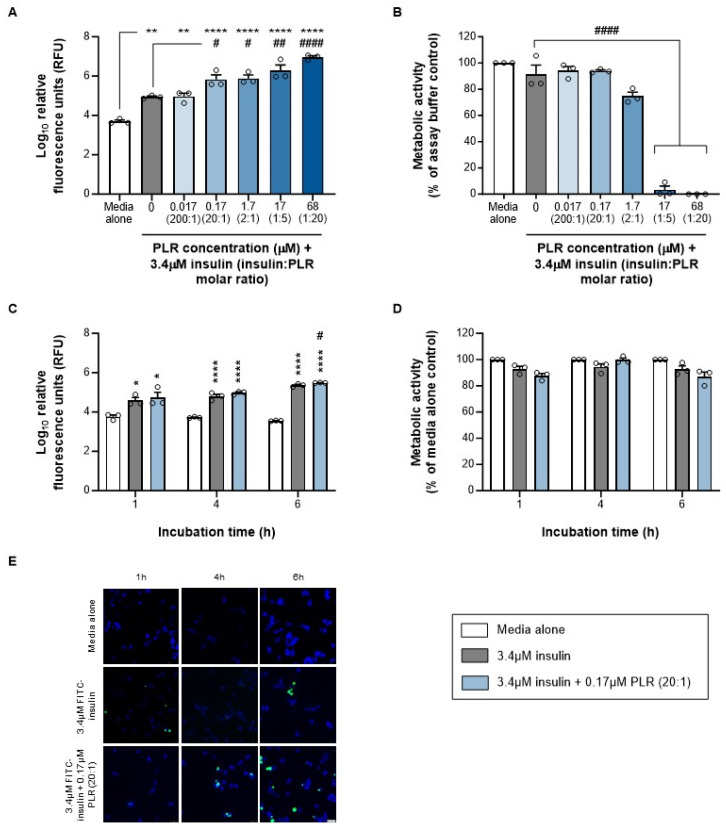
Figure 2.
PLR increases insulin uptake into RPMI 2650 nasal epithelial cells at concentrations that do not reduce cell viability. Data are shown as mean ± s.e.m. (with individual data points also shown) for (A) insulin uptake and (B) cell viability following 24 h of incubation with insulin alone (gray bars) and increasing PLR concentrations (blue bars), (C) insulin uptake and (D) cell viability following 1–6 h of incubation with insulin alone (gray bars) or 20:1 molar ratio of insulin/PLR (blue bars), as well as (E) representative images showing cells that have taken up FITC-insulin (green) as proportion of total cells, labeled with DAPI (blue); scale bar = 25 μm. */**/**** p < 0.05/0.01/0.0001 versus media alone (control) and #/##/#### p < 0.05/0.01/0.0001 versus insulin alone (one-way ANOVA with Tukey’s multiple-comparison post hoc test or two-way ANOVA with Sidak’s multiple-comparison post hoc test). Viability data from (media alone) control (B,D) have zero variance and were excluded from statistical analyses.

