Figure 4.
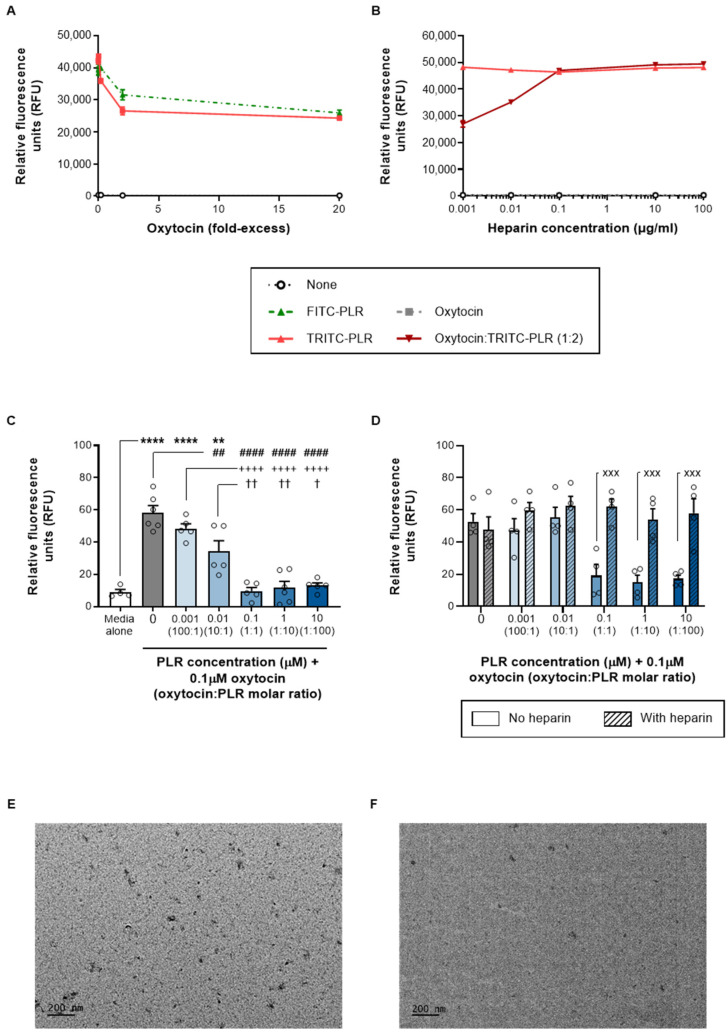
PLR complexes with oxytocin in a reversible, heparin-sensitive manner. The data are shown as the mean ± s.e.m. (with individual data points also shown on the histograms) for (A) the quenching of FITC-PLR (green dotted line) and TRITC-PLR (red solid line) fluorescence by increasing concentrations of oxytocin; (B) the dequenching of oxytocin/TRITC-PLR fluorescence by increasing concentrations of heparin (dark red line); as well as (C) the bioactivity of oxytocin alone (gray bars) in Hs 578T cells, which is reduced by increasing PLR concentrations (blue bars) and (D) restored by heparin (diagonal shaded bars). The images were obtained from a TEM examination of (E) 1:1 and (F) 1:10 ratios of oxytocin/PLR. **/**** p < 0.01/0.0001 versus media alone (control), ##/#### p < 0.01/0.0001 versus oxytocin alone, ++++ p < 0.001 versus a 100:1 molar ratio of oxytocin/PLR, †/†† p < 0.05/0.01 versus a 10:1 molar ratio of oxytocin/PLR, and xxx p < 0.001 versus the same oxytocin/PLR ratio in the absence of heparin (one-way ANOVA or two-way ANOVA with Tukey’s multiple-comparison post hoc test).

