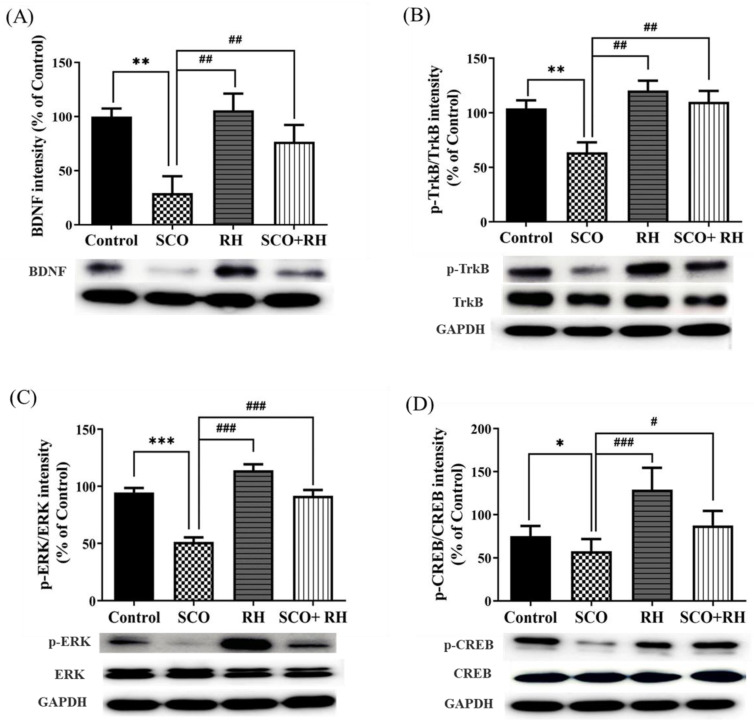
Figure 6.
Effect of RH on the BDNF, TrkB, ERK, and CREB protein expression in the SCO-induced rat hippocampus. (A) Band quantification of BDNF/GAPDH ratios. (B) Band quantification of p-TrkB/TrkB/GAPDH ratios, (C) Band quantification of p-ERK/ERK/GAPDH ratios, (D) Band quantification of p-CREB/CREB/GAPDH ratios. Final data are presented when n = 5, mean ± SEM, * p < 0.05, ** p < 0.01, *** p < 0.001 vs. control, # p < 0.05, ## p < 0.01, ### p < 0.001 vs. SCO group with the analysis performed using one-way ANOVA honest significant difference LSD test between groups. SCO, scopolamine; RH, rutin hydrate.

