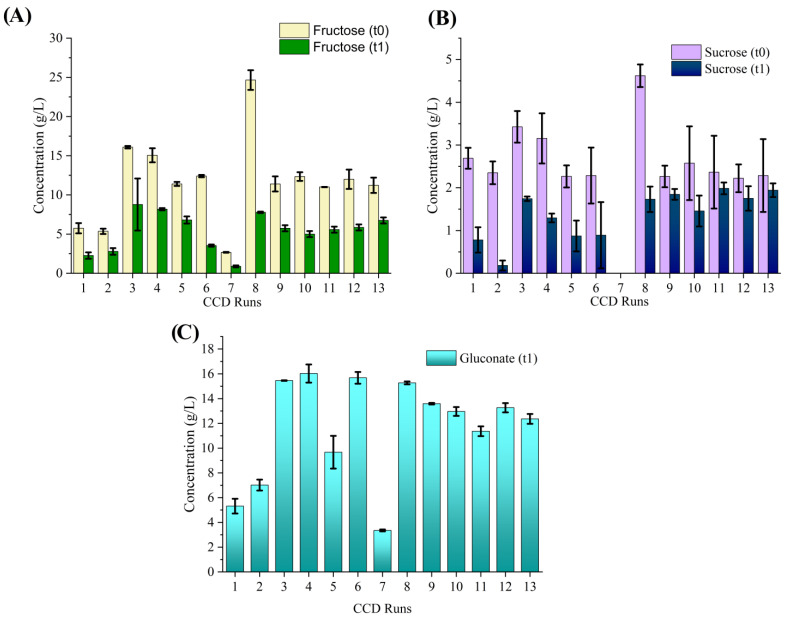
Figure 3.
Fructose (A) and sucrose (B) utilization, and gluconic acid (C) production profiles of K. sucrofermentans grown from CCD runs. The initial and final concentrations are presented in the graph as t0 and t1, respectively. The averaged values and standard deviations (indicated as error bars) from triplicate cultivations are presented. In some cases, the error bars are smaller than the edge of the plot bar.

