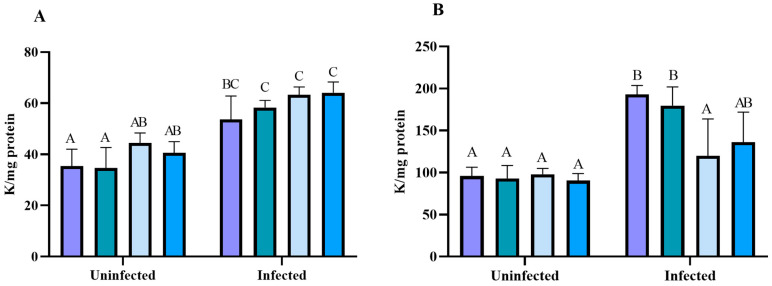
Figure 10.
Catalase activity assay in experimental acute T. cruzi infection. Swiss mice liver (A), kidney (B) enzyme activity during Y strain infection. Bars indicate mean ± SD. The differences are considered statistically significant when p < 0.05 and are demonstrated by different letters (A–C); the same letters represent no difference between groups (AB and BC).

