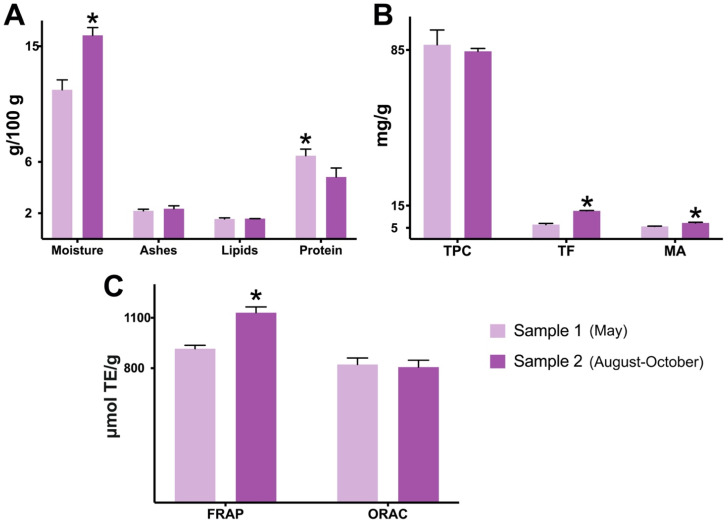
Figure 1.
Proximate and spectrophotometric composition differences between two samples of jaboticaba peel powder. Except for moisture, all results are in dry weight of jaboticaba peel powder. Sample 1: jaboticaba collected in May; sample 2: jaboticaba collected in August–October. Data are represented by mean ± standard deviation (SD). Student’s t-test (Welch’s correction, two-tailed); the asterisk symbol (*) indicates statistical difference (p < 0.05) between samples 1 and 2. (A) Proximate composition. (B) Spectrophotometric composition. (C) Antioxidant capacity. Abbreviations: FRAP—ferric-reducing antioxidant power; MA—monomeric anthocyanins; ORAC—oxygen radical absorbance capacity; TE—Trolox equivalent; TF—total flavonoids; TPC—total phenolic content.

