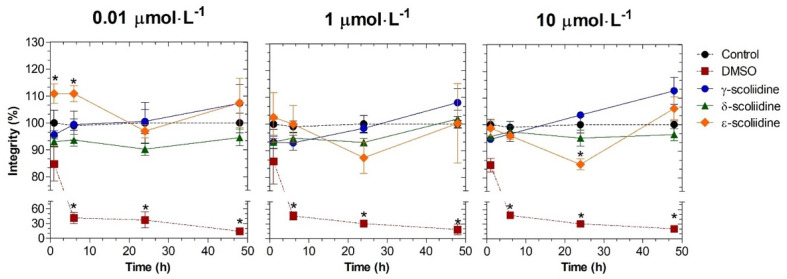
Figure 2.
Cytotoxic effects of γ-, δ- and ε-scoliidines on PC12 viability. The cells were exposed to peptides at different concentrations and times. The control and DMSO groups correspond to cells that have not been treated and cells that have been treated with a 5% concentration of DMSO, respectively. Data were collected from three separate experiments in triplicate and demonstrated as the mean ± SEM. Statistical analysis was conducted using a one-way analysis of variance (ANOVA), followed by Dunnett’s post-test. The statistical difference when compared to the control group (p < 0.05) was indicated by asterisks.

