Figure 4.
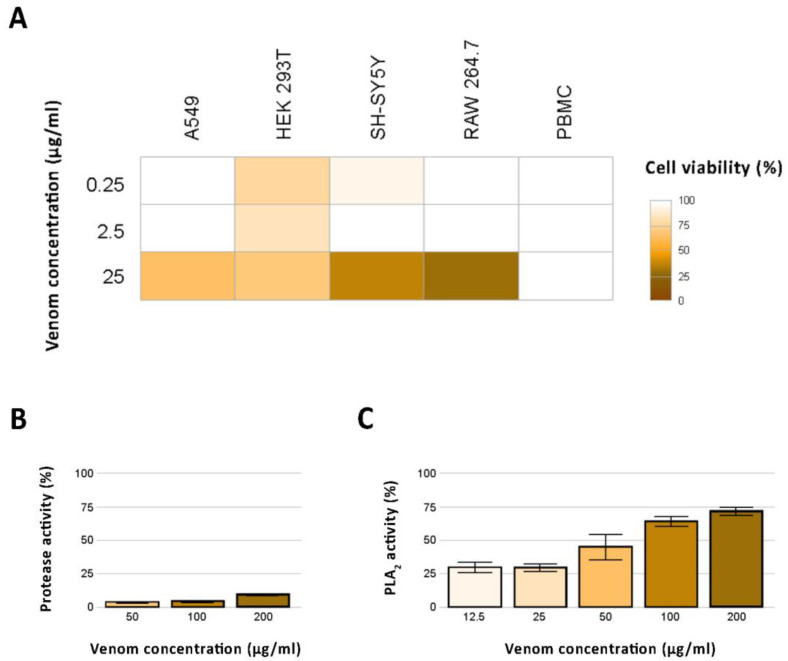
In vitro effects of N. nivea venom. (A) The heatmap shows the cytotoxic effect of the analyzed N. nivea venom on the viability of the five tested cell lines (A549, HEK 293T, SH-SY5Y, RAW 264.7, PBMC). (B) Protease and (C) phospholipase A2 activity. The bar charts illustrate the photometrically determined protease and PLA2 activity of N. nivea venom at three concentrations relative to the trypsin control, and at five concentrations relative to the PLA2 stock solution provided with the assay kit, respectively.

