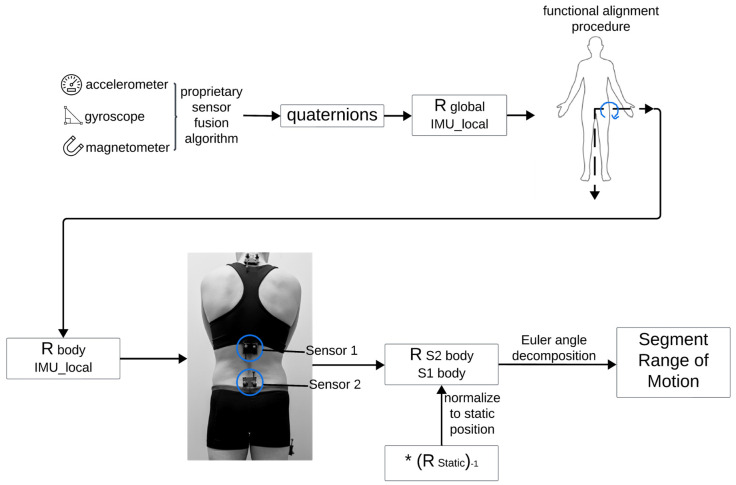
Figure 2.
Flowchart outlining derivation of kinematics for IMU data. Figure was created using Lucidspark (Lucid Software Inc., 2024, accessed 26 September 2024) and includes icons from BioRender (https://www.biorender.com/, accessed 26 September 2024) and Microsoft PowerPoint, version 16.89.1. The * represents matrix multiplication.

