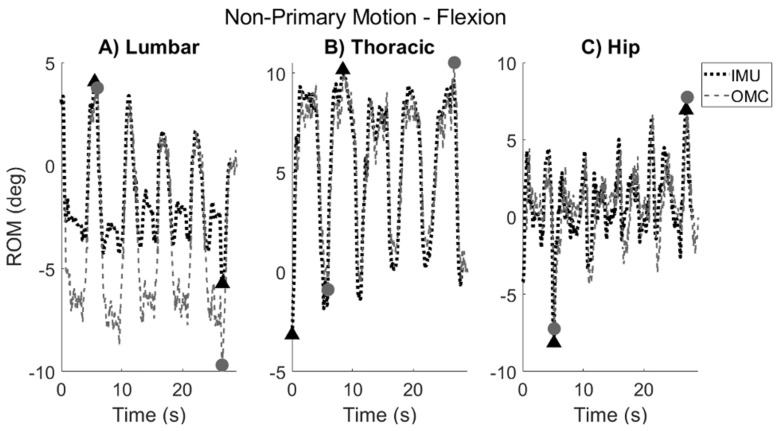
Figure 5.
Typical kinematic trace of non-primary ROM that one participant demonstrated during flexion task in the the transverse plane for (A) lumbar, (B) thoracic, and (C) hip segments. The IMU kinematic trace is shown by the dotted black line, and the OMC trace is shown by the dashed gray line. Positive values correspond to left rotation. Maximum and minimum ROM achieved over entire trial (indicated by black triangles for IMU and gray circles for OMC) were extracted to derive non-primary ROM values.

