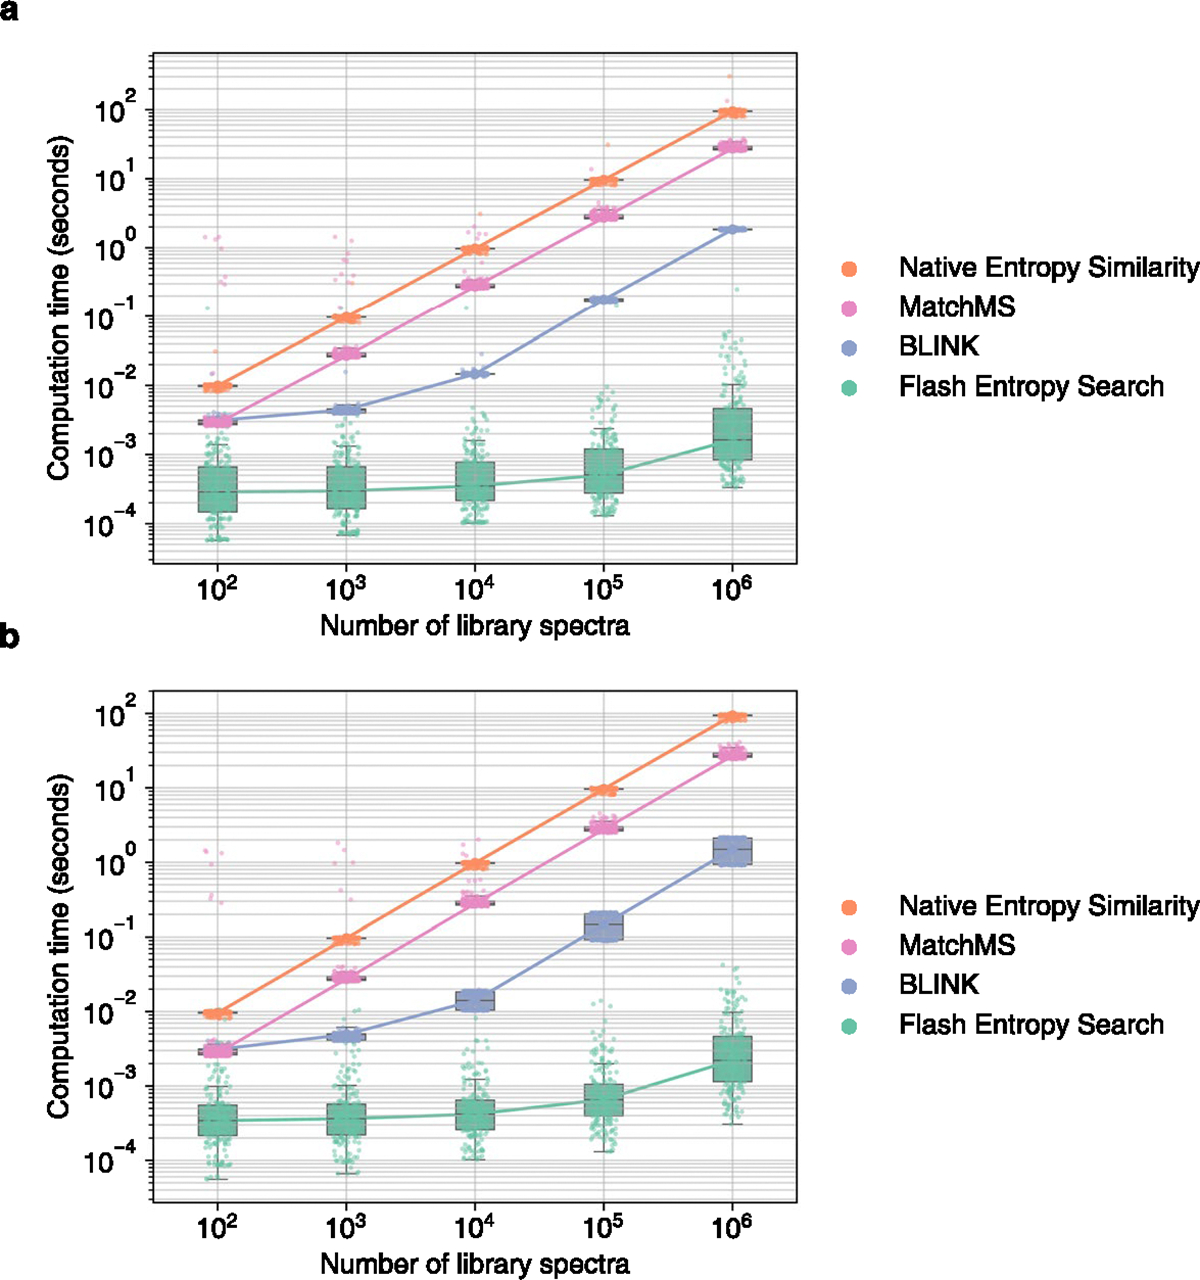
Extended Data Fig. 3 |. Computation time required to perform ‘open search’ queries using entropy similarity for 100 positive ESI and 100 negative ESI mass spectra against spectral libraries of different sizes.

MS/MS spectra were sampled from (a) GNPS (b) public repositories. Box plots display medians as horizontal lines inside the boxes that delineate interquartile ranges (IQR). Whiskers extend to the lowest or highest data point within 1.5x IQR of the 25% and 75% quartiles. N = 200 independent MS/MS spectra randomly sampled from (a) GNPS (b) public.
