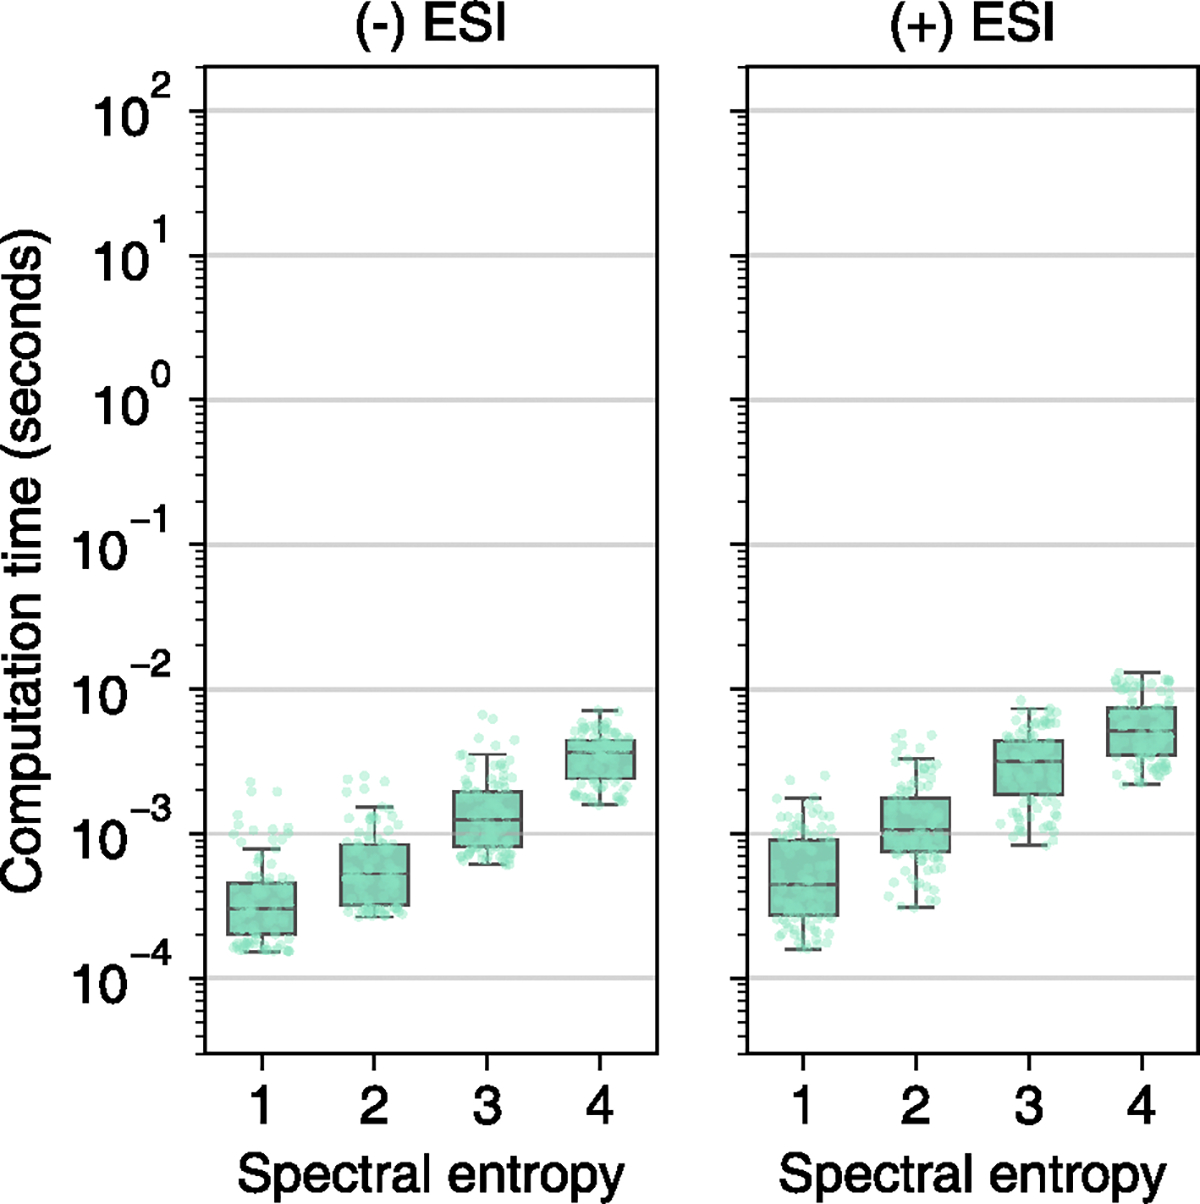
Extended Data Fig. 7 |. Calculation time to open search 100 positive ESI and 100 negative ESI MS/MS spectra at different spectral entropy levels against randomly picked samples from the MassBank.us library.

Box plots display medians as horizontal lines inside the boxes that delineate interquartile ranges (IQR). Whiskers extend to the lowest or highest data point within 1.5x IQR of the 25% and 75% quartiles. N = 100 independent MS/MS spectra randomly sampled from MassBank.us.
