Fig. 1.

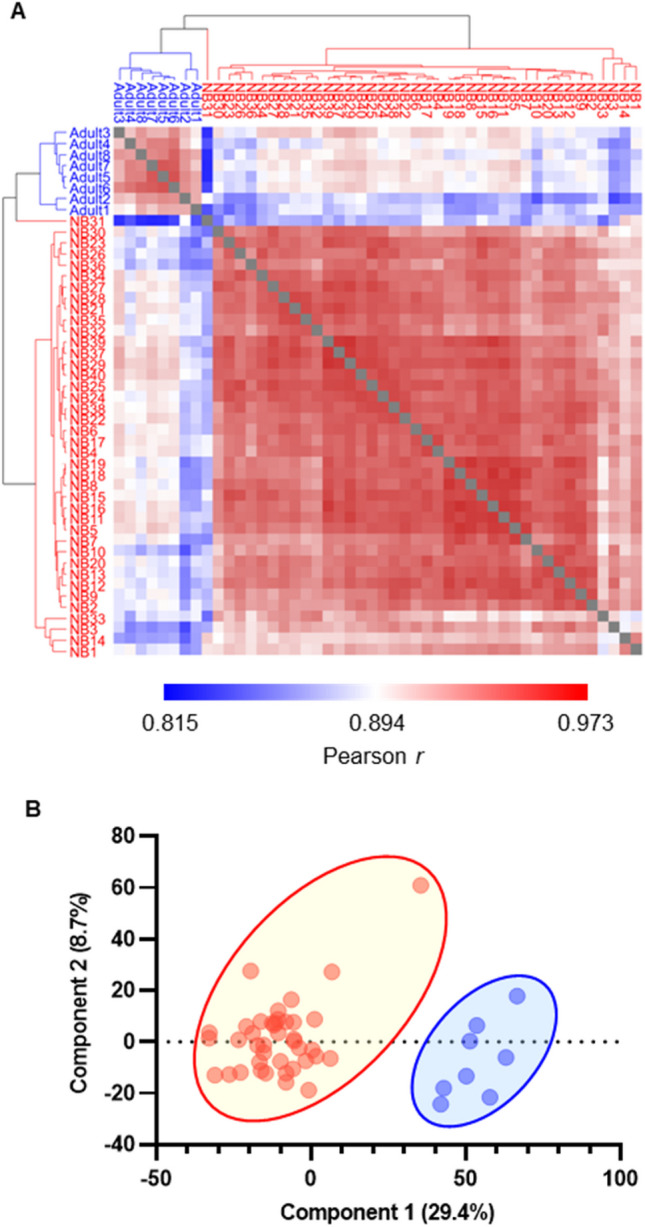
Proteomics analysis distinguishes healthy newborn dried blood spot (DBS) samples from those of adults. A Clustered heatmap of Pearson correlation coefficient values between all healthy newborn and adult DBS sample pairs. Dark red denotes higher correlation and dark blue denotes lower correlation (Pearson r = 0.82–0.96). B Principal component analysis of healthy newborn and adult DBS sample pairs. Red denotes newborn (NB) and blue denotes adult DBS samples
