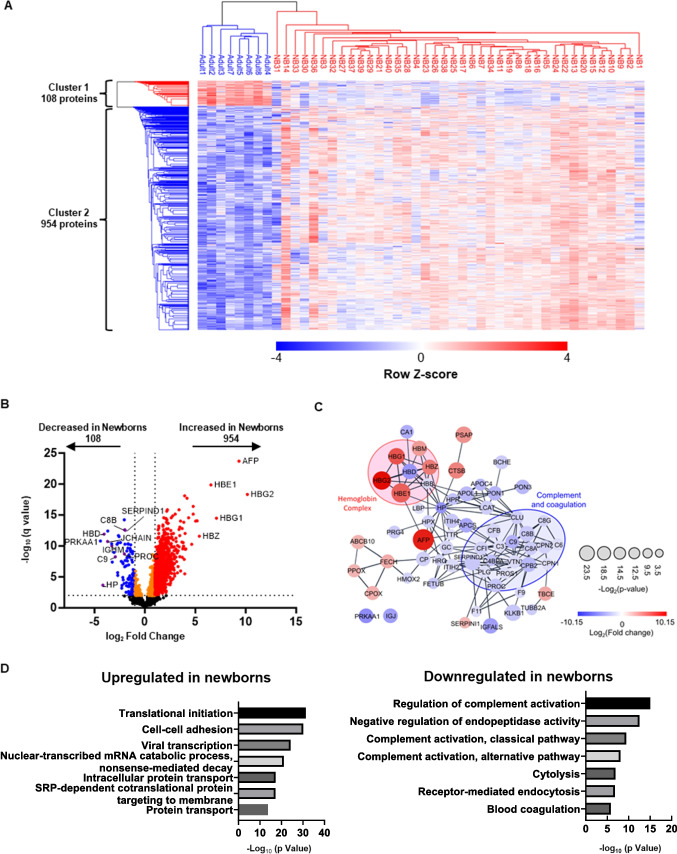
Fig. 2.
Proteins differentially expressed between healthy newborn and adult samples. A Heatmap of hierarchical clustering of all differentially expressed proteins (DEPs) detected by comparison between healthy newborn and adult samples. Red, upregulated DEPs; blue, downregulated DEPs. B Volcano plot showing DEPs in dried blood spot samples from healthy newborns compared with those from healthy adults. C Protein–protein interaction network analysis illustrating the top 100 upregulated and downregulated proteins (q-value < 0.05), contrasting healthy newborns and adults; network generated in Cytoscape using the STRING database. Node size corresponds to P value, while colors (red and blue) signify DEPs; red and blue circles represent the 'Hemoglobin complex' and 'Complement and coagulation' Gene Ontology (GO) terms, respectively. D GO enrichment analysis of DEPs. Bar charts showing the top 10 GO terms for biological processes upregulated (left) and downregulated (right) in newborn samples relative to adult samples

