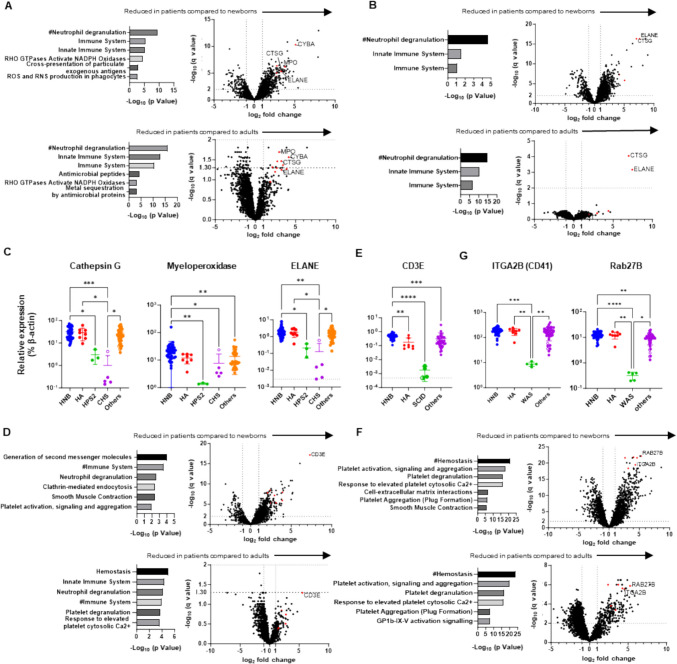
Fig. 5.
Identification of marker proteins associated with molecular phenotypes of inborn errors of immunity (IEIs). Gene ontology enrichment analysis of differentially expressed proteins (DEPs) (left) and volcano plots showing DEPs (right) in dried blood spot (DBS) samples from patients with (A) Hermansky-Pudlak syndrome type 2 (HPS2: n = 3), (B) Chédiak-Higashi syndrome (CHS: n = 5), (D) SCID: n = 4, and (F) Wiskott-Aldrich syndrome (WAS: n = 5) relative to samples from healthy newborns (HN) (left) and healthy adults (HA) (right). Levels of (C) cathepsin G, myeloperoxidase, and ELANE, (E) CD3E, and (G) ITGA2B (CD41) and Rab27B in DBS samples from HNB, HA, and patients with IEIs. Statistical differences among groups were analyzed using one-way ANOVA on ranks (the Kruskal–Wallis test), followed by Dunn’s multiple comparisons. Data represent the mean ± SD. *P < 0.05, **P < 0.01, ***P < 0.001, ****P < 0.0001. #, Top Gene Ontology terms commonly altered in patient samples compared to both newborn and adult control groups. Red dots in volcano plots indicate proteins shared in biological pathways commonly altered in patient samples relative to those from HN and HA

