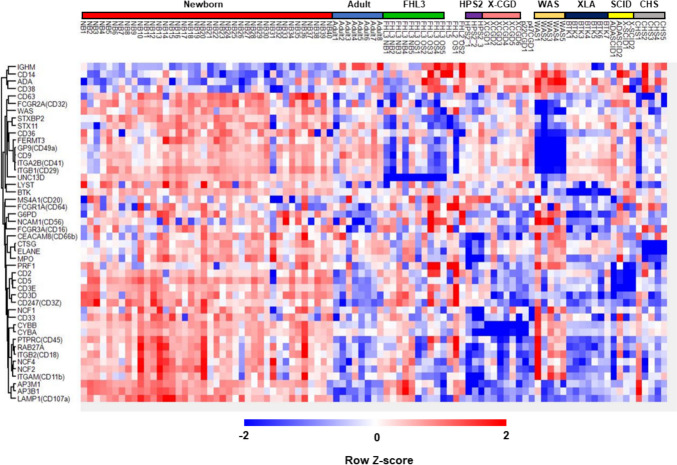
Fig. 6.
Comparison of proteomics data from patients with inborn errors of immunity with those from healthy newborns and adults. Heatmap showing hierarchical clustering of the levels of 42 proteins that are disease-responsive or associated with molecular phenotypes in dried blood spot samples from healthy newborns, healthy adults, and patients with inborn errors of immunity. Red, relatively higher expression; blue, relatively lower expression

