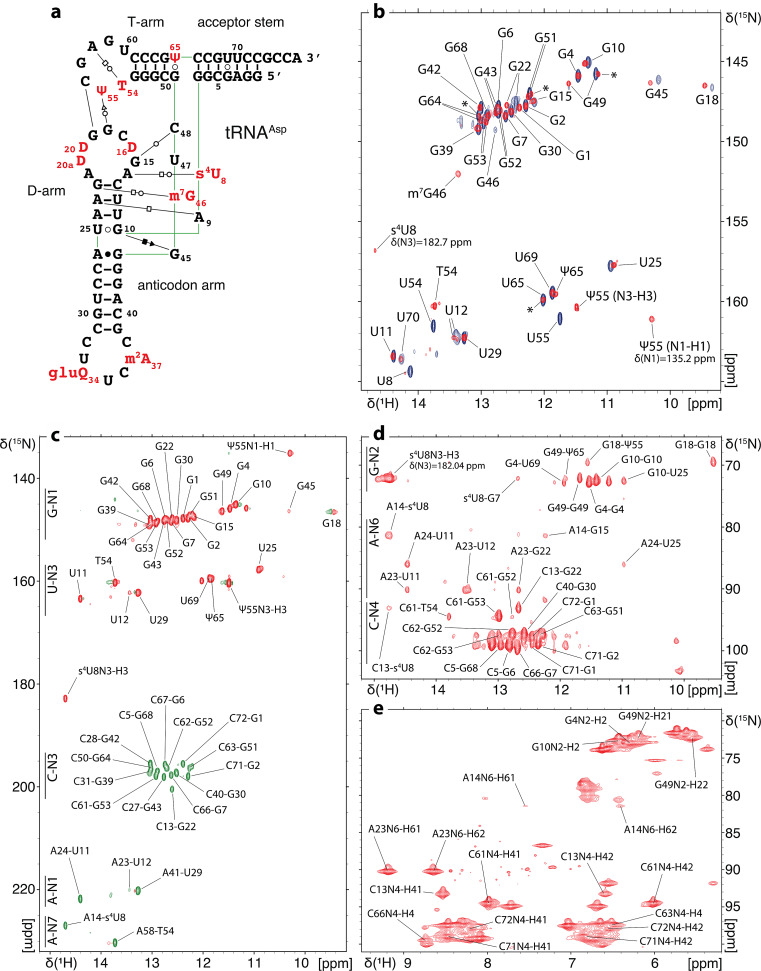
Fig. 2.
1H, 15N chemical shift assignment of the imino and amino groups of E. coli tRNAAsp(GUC). (a) Sequence and L-shape 2D representation of modified E. coli tRNAAsp(GUC). Modified residues are represented in red. The nature of interactions between base pairs is described according to the classification by Leontis and Westhof (Leontis and Westhof 2001). (b) (1H,15N)-BEST-TROSY spectrum and assignment of the imino groups of unmodified and modified E. coli tRNAAsp. Signals from the unmodified sample are represented in blue and signals from the modified sample are in red. Asterisks denote peaks in the modified sample that correspond to a subpopulation in which U65 is not modified into Ψ65. (c) (1H,15N)-BEST-TROSY-HNN-COSY spectrum showing correlations across hydrogen bonds in the modified tRNAAsp. (d) (1H,15N)-CPMG-NOESY-HSQC enabling the chemical shift assignment of the amino groups in the modified tRNAAsp. (e) (1H,15N)-HSQC spectrum showing the chemical shift assignment of the NH2-amino groups of modified tRNAAsp

