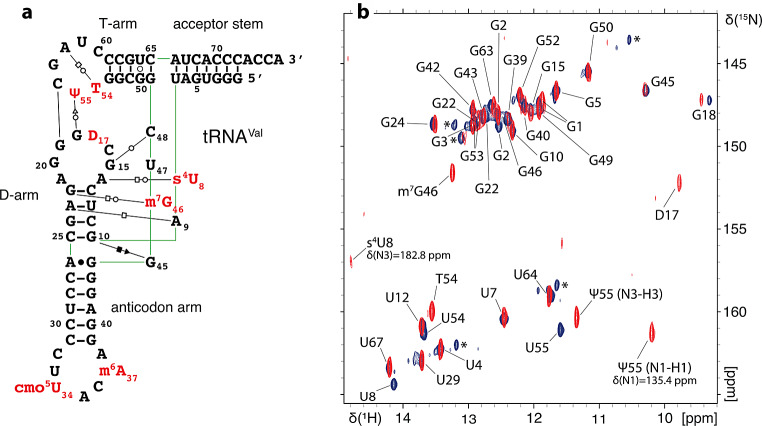
Fig. 3.
1H,15N chemical shift assignment of the imino groups of E. coli tRNAVal(UAC). (a) Sequence and L-shape 2D representation of modified E. coli tRNAVal(UAC). The same code is used as on Fig. 2. (b) (1H,15N)-BEST-TROSY spectrum and assignment of the imino groups of unmodified and modified E. coli tRNAVal. Signals from the unmodified sample are represented in blue and signals from the modified sample are represented in red. Asterisks denote peaks that correspond to an alternative folding of unmodified tRNAVal

