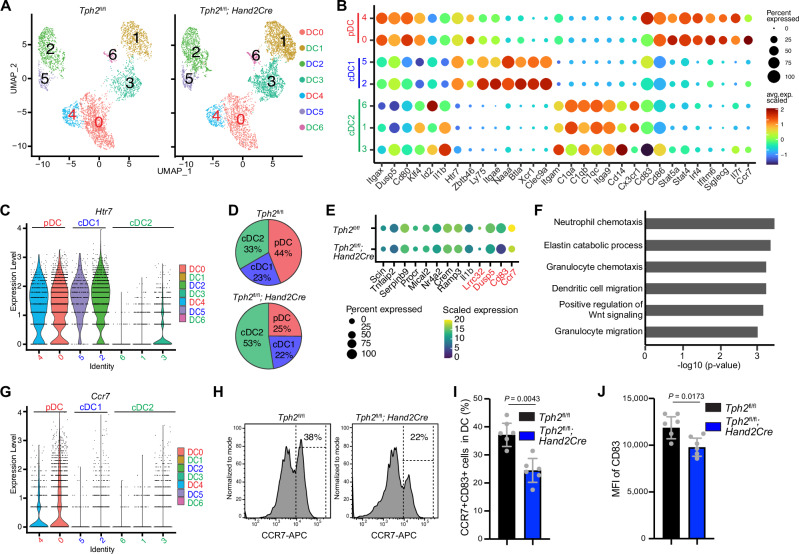
Fig. 4. Enteric serotonergic neurons remodel pDC function in vivo.
A UMAP plot of single-cell transcriptome data of small intestinal LPDC from Tph2fl/fl and Tph2fl/fl; Hand2-Cre mice. B Marker gene expression used for annotation of LPDC subsets. C Violin plots depicting the range of expression levels of Htr7 in distinct LPDC clusters. D Pie charts showing the proportion of pDC is decreased in Tph2fl/fl; Hand2-Cre vs Tph2fl/fl mice. E Comparison of the expression of the indicated genes in pDC between Tph2fl/fl and Tph2fl/fl; Hand2-Cre mice. The dot color reflects the level of gene expression, and the dot size represents the percentage of cells expressing the indicated gene. The genes labeled in red exhibit decreased expression in pDC from Tph2fl/fl; Hand2-Cre mice and are consistent with the serotonin-induced genes observed in vitro. F GO Pathway analysis of genes that exhibited decreased expression in pDCs of Tph2fl/fl; Hand2-Cre vs Tph2fl/fl mice. G Violin plots depicting the range of expression levels of Ccr7 in distinct LPDC clusters. H Representative histogram plots showing the percentage of pDC (Live, CD45+, MHC-II+, CD64−, CD11c+, CCR7+) in LPDC from the small intestine of Tph2fl/fl and Tph2fl/fl; Hand2-Cre mice by flow cytometry. I Flow cytometry analyses of frequency of pDC in LPDC from the small intestine of Tph2fl/fl and Tph2fl/fl; Hand2-Cre mice. n = 6 mice per group. J Flow cytometry analyses of CD83 expression on pDC from the small intestine of Tph2fl/fl and Tph2fl/fl; Hand2-Cre mice. MFI mean fluorescence intensity. n = 6 mice per group. Data shown are means ± SD. Statistical analysis was performed by a two-tailed Mann–Whitney test in I and J.

