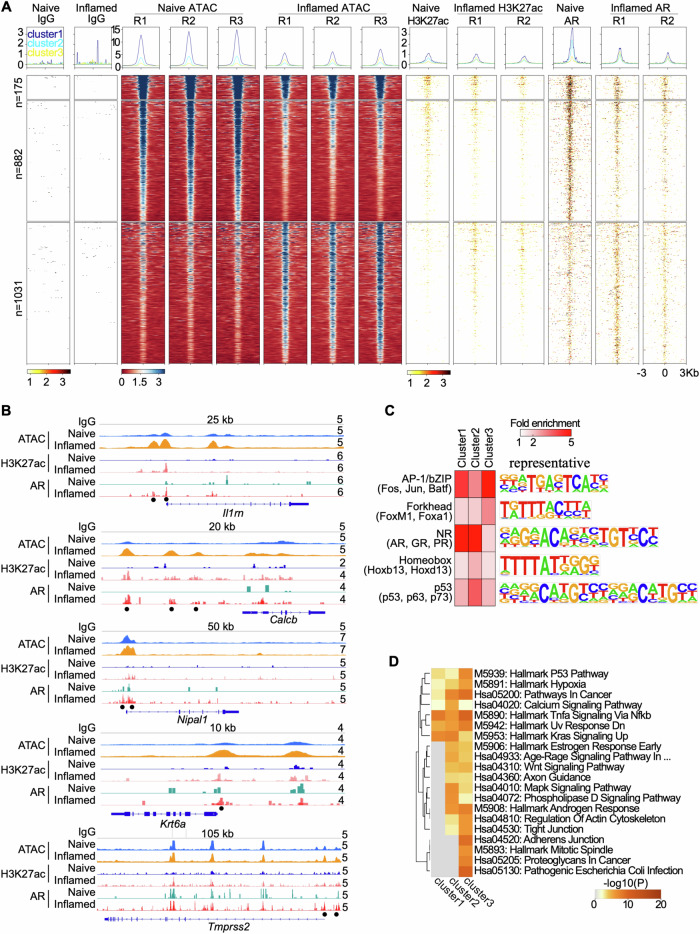
Fig. 4. Genome-wide profiling of chromatin accessibility and AR binding.
A Histograms (above) and heatmaps (below) showing signal intensity of IgG, ATAC, H3K27ac, and AR peaks across naïve and inflamed bPSC, with biological replicates indicated as R1, R2, and R3. Differential peaks between naïve and inflamed bPSC with AR binding are displayed in three clusters. B Genome browser tracks at the Il1rn, Calcb, Nipal1, Krt6a, and Tmprss2 loci showing IgG, ATAC, H3K27ac, and AR signal in naïve and inflamed bPSC. Black dots represent peaks induced in inflamed bPSC. Track heights are indicated on the right corner for each track. C Enriched transcription factor (TF) DNA motifs at peak loci in each cluster. Shown are TF families on the left with representative TF members in parenthesis and a representative TF logo on the right. D Enrichment of KEGG and Hallmark pathways in genes adjacent to peaks from each cluster.

