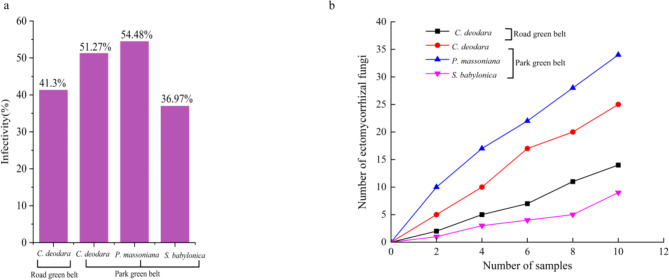
Fig. 1.
Ectomycorrhizal fungi (EMF) infection rate (a) and dilution curves (b) of different greening tree species. The height of the purple bars in (a) represents the extent of EMF infection in the greening tree species.  represents Cedrus deodara in the roadside green belts;
  represent Cedrus deodara in the park roadside green belts;
  represent Pinus massoniana in the park roadside green belts;
  represent Salix babylonica in the park roadside green belts.

