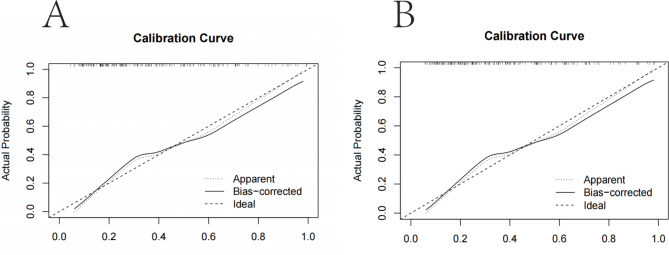
Fig. 5.
Calibration curves of the risk nomogram prediction of worsening postoperative GERD symptoms after LSG. The y-axis meant the actual postoperative worsening of GERD symptoms. The x-axis meant the predicted risk of worsening postoperative GERD symptoms. The diagonal dotted line meant a perfect prediction by an ideal model. The solid line represented the performance of the training set (Fig. 5A) and validation set (Fig. 5B), which indicated that a closer fit to the diagonal dotted line represented a better prediction.

