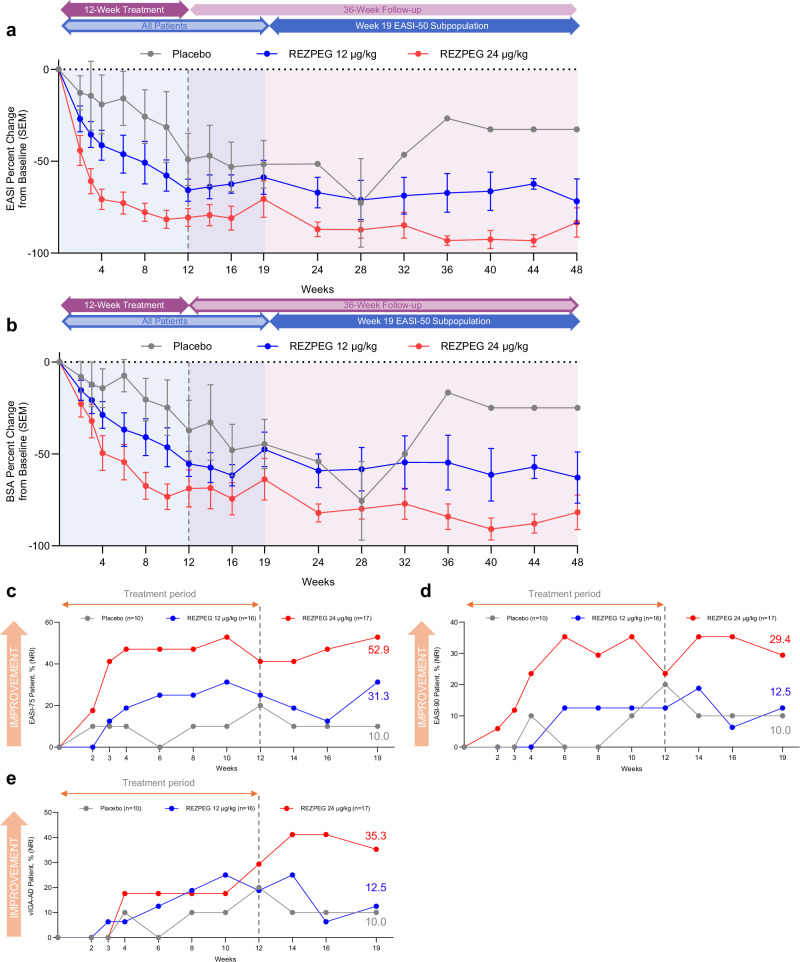
Fig. 4. AD investigator-assessed efficacy outcomes.
a EASI score mean % change from baseline ± SEM. b BSA score mean % change from baseline ± SEM. c, Proportion of EASI-75 patients whose EASI score decreased by at least 75% relative to baseline. d Proportion of EASI-90 patients whose EASI score decreased by at least 90% relative to baseline. e Proportion of vIGA-AD responders, patients with a post-baseline vIGA-AD score of 0 or 1 and a ≥ 2-point improvement from baseline. Red, REZPEG 24 µg/kg; blue, REZPEG 12 µg/kg; grey, placebo. For continuous endpoints using observed data (a and b), number of subjects at each time point shown in Supplementary Table 9. All responder data shown as % of adjusted ITT populations. BSA, body surface area; EASI, Eczema Area and Severity Index; ITT, intention to treat; NRI, non-responder imputation; SEM, standard error of the mean, vIGA-AD, Validated Investigator Global Assessment for Atopic Dermatitis. Source data are provided as a Source Data file.

