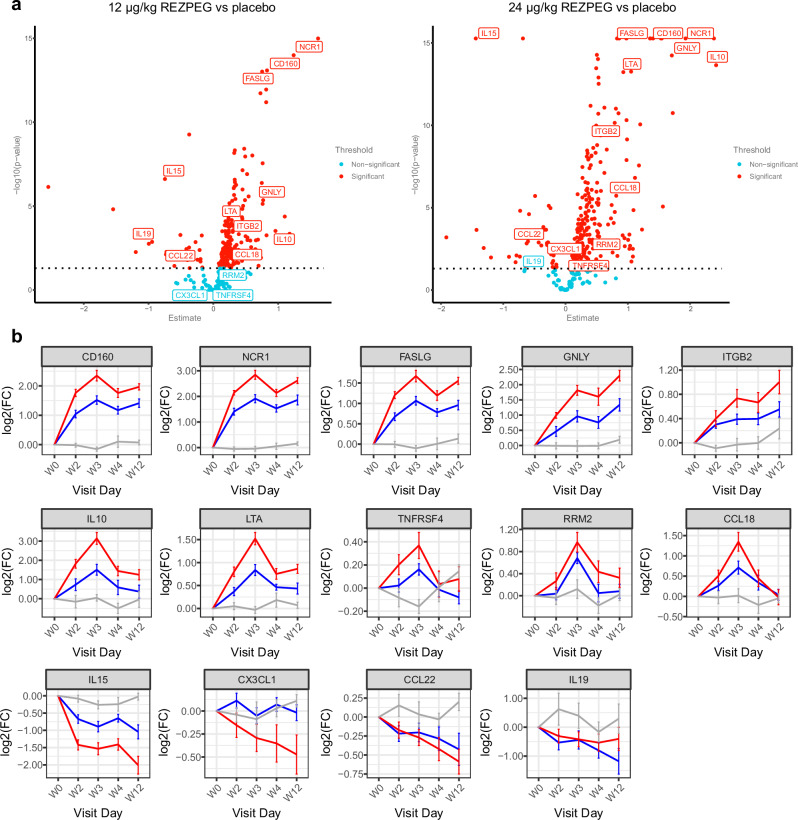
Fig. 7. Serum proteomic biomarker analysis.
a Dose-dependent volcano plots of the serum proteins showing the -log10(p-value) vs fold-change in protein expression in response to REZPEG treatment compared to placebo. Data were fitted with a linear mixed model with multiple testing correction using Benjamini-Hochberg. Statistical comparisons were made between treatment and placebo using the Tukey method. Proteins with a statistically significant treatment-based change (threshold p < 0.05) are indicated by red circles; those with non-significant changes are indicated by teal circles. b Example line charts of differentially-detected serum proteins over the 12-week REZPEG treatment induction period shown as Log2 fold change (FC) in expression from baseline ± SEM. Red, REZPEG 24 µg/kg; blue, REZPEG 12 µg/kg; grey, placebo. Number of samples at each time point provided in Supplementary Table 10. CCL, CC motif chemokine ligand; CD160, cluster of differentiation 160; CX3CL1, C-X3-C motif chemokine ligand 1 (fractalkine); FASLG, Fas ligand; GNLY, granulysin; IL, interleukin; ITGB2, integrin beta 2 (CD18); Log2(FC), Log2 fold change; LTA, lymphotoxin alpha; NCR1, natural cytotoxicity triggering receptor 1 (NKp46); RRM2, ribonucleotide reductase regulatory subunit M2; SEM, standard error of the mean; TNFRSF4, tumor necrosis factor receptor superfamily member 4 (CD134, OX40). Source data are provided as a Source Data file.

