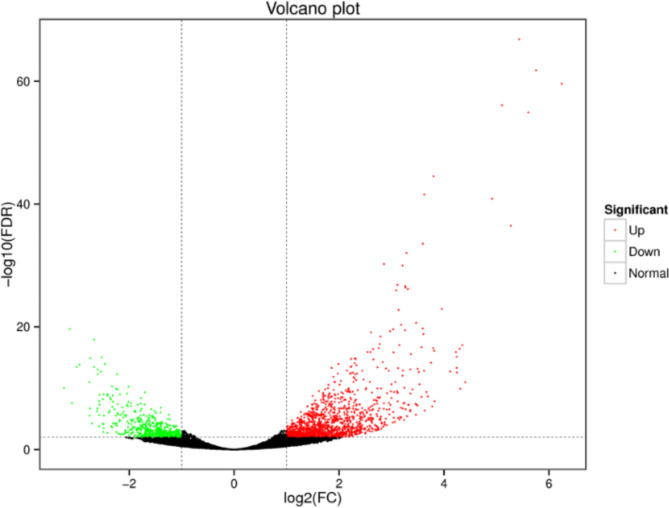
Fig. 1.
Volcano Plot of DETs. Each point in the differential volcano plot represents a transcript, the ventral axis represents the logarithmic value of the multiplicity of difference in expression of the transcript in two samples; the two samples are A. pisum feeding on two varieties of alfalfa. A. pisum fed on LRH are presented as LF aphids and the pea aphids fed on GN5 are presented as the GF aphids, and the vertical axis represents the negative logarithmic value of the statistical significance of the change in transcript expression. The larger the absolute value of the ventral coordinate, the greater the fold difference in expression between the two samples. The larger the value of the vertical coordinate, the more significant the differential expression and the more reliable the differentially expressed transcripts. Green dots in the graph represent down-regulated differentially expressed transcripts, red dots represent up-regulated differentially expressed transcripts, and black dots represent no differentially expressed transcripts.

