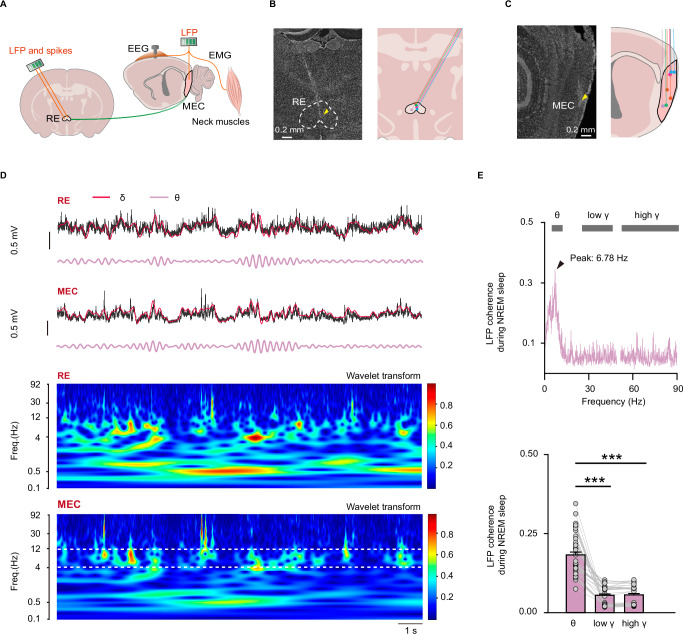
Fig. 2. RE displays typical theta waves that synchronize with MEC theta oscillations.
A Schematic of in vivo multi-channel synchronous recording in the RE and MEC, combined with EEG-EMG recording. B, C Images showing the electrode implanted in the RE (B) and MEC (C) (n = 5 mice). D Simultaneous recording of LFP (gray: raw trace; red: filtered delta; magenta: filtered theta) and corresponding power spectrum in the RE (top) and MEC (bottom) during NREM sleep. The range between two white dashed lines is the theta band in the MEC LFP power spectrum. E Diagram showing LFP coherence in different bands between RE and MEC during NREM sleep (top). Peak of LFP coherence (black arrowhead) is at the theta band. Comparison of LFP coherence in the RE and MEC during NREM sleep (bottom) (Friedman repeated measures ANOVA on ranks followed by post hoc Student–Newman–Keuls test, n = 51, theta vs low gamma: q = 8.317, P = 1.55 × 10⁻⁹; theta vs high gamma: q = 6.832, P = 1.54 × 10⁻⁹; low gamma vs high gamma: q = −1.485, P = 0.412). ***P < 0.001. Data are presented as mean ± s.e.m. Source data are provided as a Source Data file.

