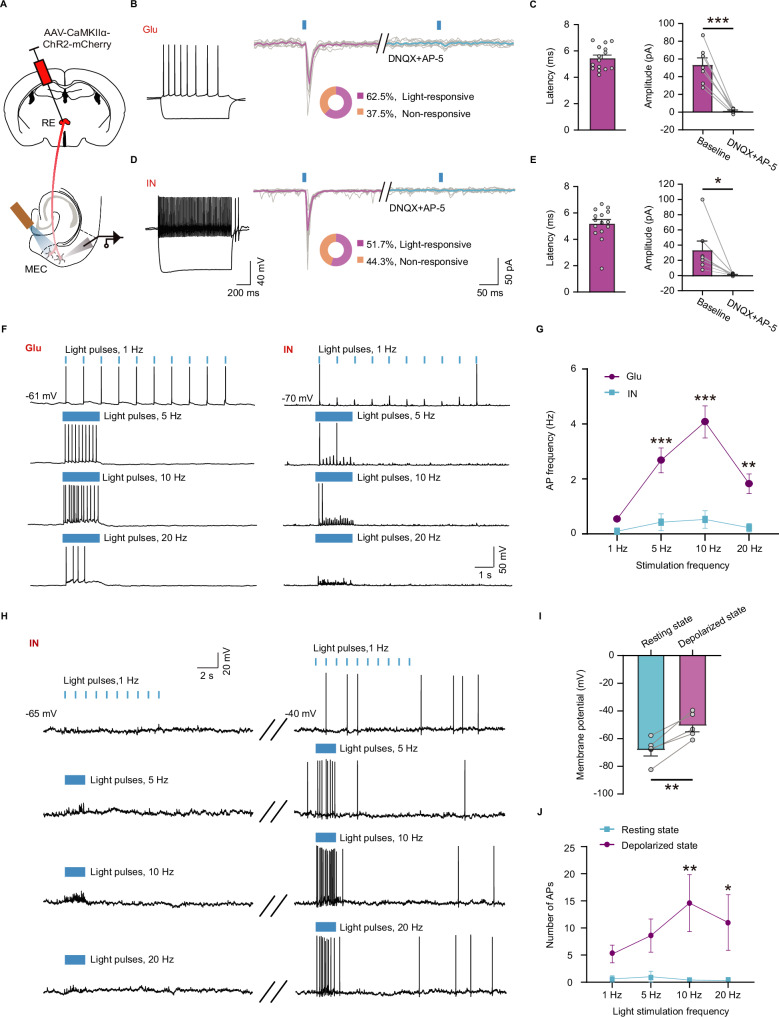
Fig. 3. MEC integrates monosynaptic excitatory inputs from RE neurons.
A Scheme for recording the evoked postsynaptic responses. B Left, electrophysiological property of glutamatergic neurons (Glu). Right, optostimulation evokes EPSCs in glutamatergic neuron in the presence (cyan trace) and absence (magenta trace) of DNQX and AP-5, and proportion of neurons that responded to stimulation of RE inputs. C Left, latency of glutamatergic neurons in response to light-stimulated RE inputs. Right, amplitude of the evoked EPSCs in the presence and absence of DNQX and AP-5 (Two tailed paired t test, t6 = 7.227, n = 7 cells, P = 0.0004). D Same as (B) but for MEC GABAergic interneurons (IN). E Left, latency of MEC GABAergic interneurons in response to light-stimulated RE inputs. Right, same as (C) but for GABAergic interneurons (Wilcoxon signed-rank test, n = 7 cells, Z = −2.336, P = 0.016). F Sample traces showing responses of glutamatergic neurons (left) and GABAergic interneurons (right) to light pulses. G Frequency of action potentials (AP) evoked by light pulses of glutamatergic neuron (magenta, n = 10 cells) and GABAergic interneuron (cyan, n = 10 cells) (Two-way Repeated Measures ANOVA followed by post hoc Bonferroni t test, Glu vs IN, F1,18 = 21.045, P = 0.00131; stimulation frequency factor, F3,54 = 40.945, P = 3.48 × 10⁻¹⁰; interaction, F3,54 = 14.707, P = 7.18 × 10⁻⁶). H Responses of GABAergic interneurons evoked by light pulses with voltage holding at −65 mV (left) or −40 mV (right). I Membrane potential of GABAergic interneurons when holding at resting states or depolarized states (two-tailed paired t test, n = 5 cells, t4 = −6.692, P = 0.0026). J Number of action potentials evoked by light stimulation (Scheirer–Ray–Hare test followed by post hoc Holm-Sidak method, n = 5 cells; resting state vs. depolarized state, H = 6.524, P = 7.51×10⁻¹¹; stimulation frequency factor, H = 0.125, P = 0.632; interaction, H = 0.183, P = 0.48). *P < 0.05, **P < 0.01, ***P < 0.001. Data are presented as mean ± s.e.m. Source data are provided as a Source Data file.

