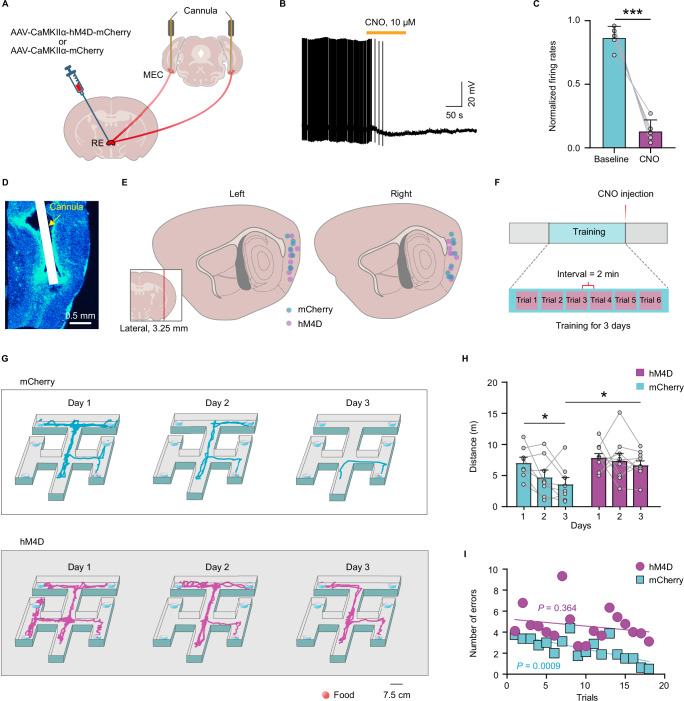
Fig. 5. Chemogenetic inhibition of RE-MEC pathway after training impaired spatial memory.
A Schematic of chemogenetic inhibition of RE-MEC pathway. B Representative trace showing the inhibitory effect of CNO (10 μM, 2 min) on the firing activities of an example hM4D-expressing RE neuron projecting to MEC. C Bath application of CNO suppressed the firing rates of the RE neurons (Two tailed paired t test, t4 = 9.396, n = 5 cells, P = 0.000715). D Representative sagittal section showing the cannula implanted in the MEC. E Microinjection sites were depicted as filled cyan (mCherry) or magenta (hM4D) circles for the tested mice. F Experimental design of CNO-induced chemogenetic inhibition of RE-MEC pathway combined with the spatial memory task. G Representative trajectories of the mice in the mCherry (top) or hM4D (bottom) group searching for food in the six-arm maze. H The distance that animals of the mCherry and hM4D groups traveled in the maze to acquire food each day (two-way repeated measures ANOVA followed by post hoc Bonferroni t test, n = 8 mice for mCherry group, n = 9 mice for hM4D group; mCherry vs hM4D, F1, 15 = 4.696, P = 0.047; days factor: F2, 30 = 4.510, P = 0.019; interaction, F2, 30 = 1.194, P = 0.317). I Average number of errors that animals in the mCherry and hM4D groups made when searching for food during 6 trials each day. Cyan circles or magenta blocks represent mean value for each trial of mCherry (n = 8 mice) or hM4D group (n = 9 mice). Trend lines are the least-square fits to the data. *P < 0.05, ***P < 0.001. Data are presented as mean ± s.e.m. Source data are provided as a Source Data file.

