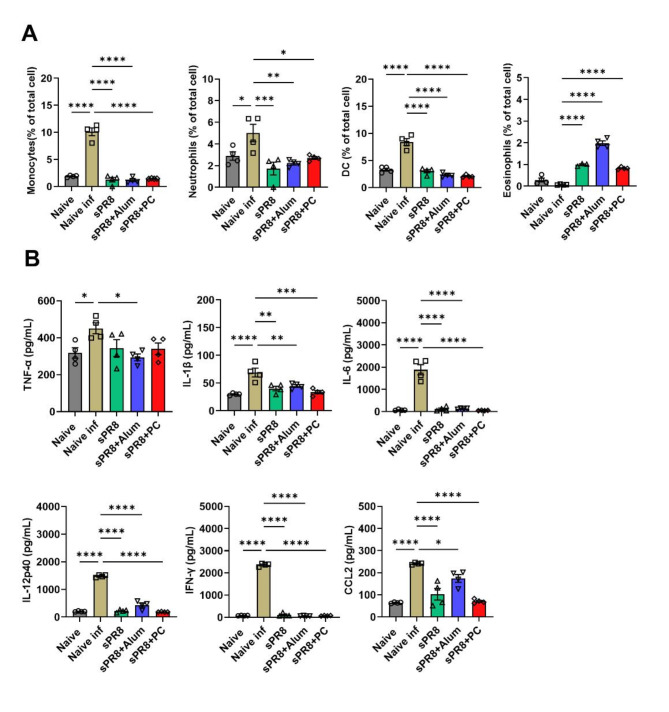
Fig. 4.
Cellular infiltration and cytokine production in the lungs after the lethal virus challenge. The immunized mice (n = 4) were infected with A/PR8 virus (1 x LD50) after 16 weeks of boost immunization. Lung samples were harvested at 7 days post-infection and cell phenotypes were determined by flow cytometry and cytokine levels of each sample were measured by ELISA. Means ± standard errors were shown with individual dots. One-way ANOVA and Tukey’s multiple comparison test were performed for statistical analysis. *p < 0.0332; **p < 0.0021; ***p < 0.0002; ****p < 0.0001 compared to naïve infected group.

