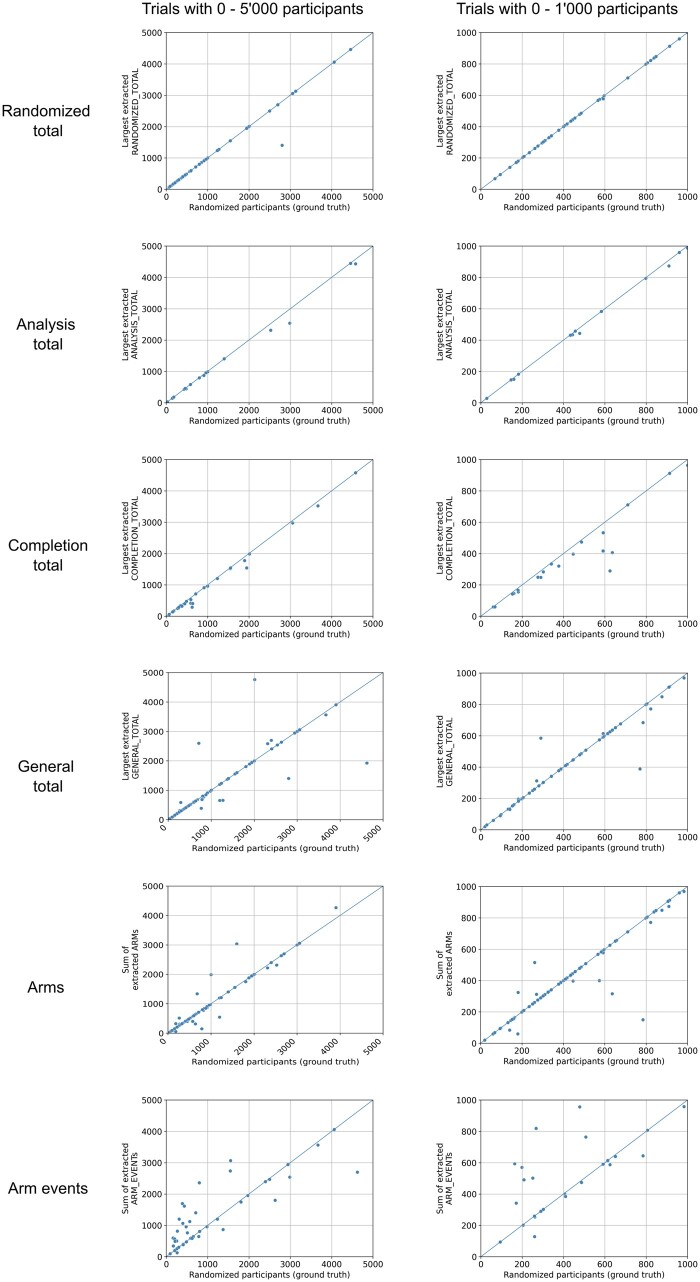
Figure 1.
Scatterplots of different extracted entities. Each dot represents a trial with the ground truth, ie, the number of participants who were randomized being its x-coordinate. The y-coordinate is the respective entity. For the randomized total, analysis total, completion total, and general total entities, the largest respective number was used in case multiple numbers were extracted from the same trial. In case of the arm and arm event entities, all extracted numbers from the same entity for a trial were summed up. Plots on the left show trials with 0-5000 participants, while plots on the right show only trials with 0-1000 participants to allow for a better assessment of the performance in the range that most trials fall into. The diagonal lines indicate perfect predictions.

