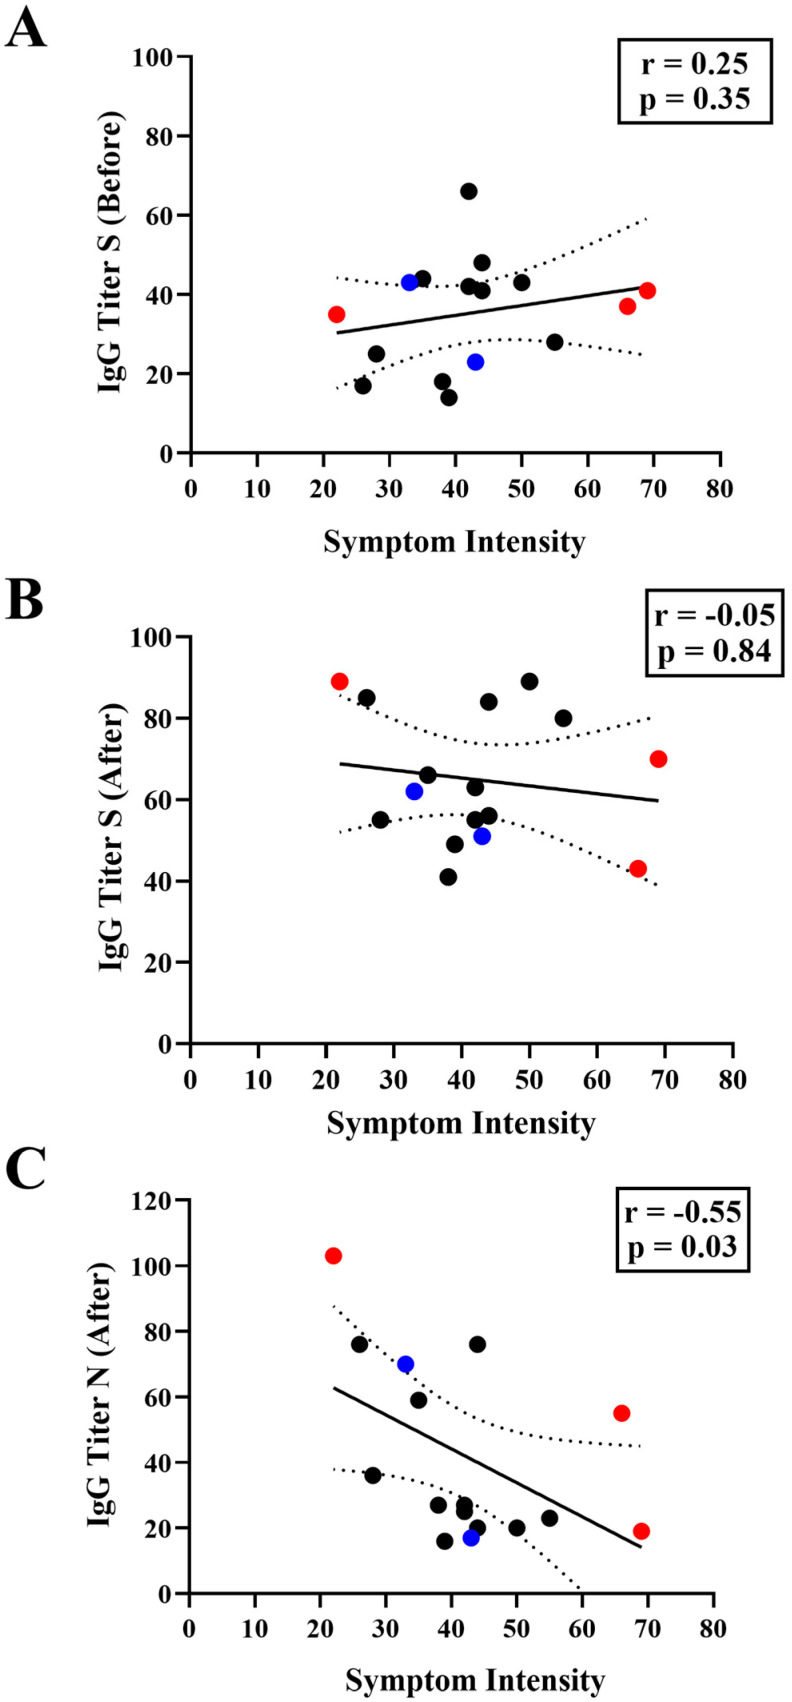
Figure 4.
Correlation between IgG titers and symptom intensity. The symptom intensity (x-axis) is plotted against the IgG titers (y-axis) reactive to the Spike antigen (anti-S) observed before (A) and after (B) a SARS-CoV-2 infection event. (C) Correlation between the symptom intensity (x-axis) vs the IgG titers (y-axis) reactive to the Nucleocapsid antigen (anti-N) observed after a SARS-CoV-2 infection event. The symptom intensity of the infection was determined by the sum of frequencies related to the self-reported intensity level (scale of 0 to 10) of each symptom described by the participants of this study (Table S1). Blue dots indicate individuals who had SARS-CoV-2 infection after primary vaccination. Red dots indicate individuals with hybrid immunity (individuals reporting a previous SARS-CoV-2 infection before enrollment in this study) and who had SARS-CoV-2 infection after booster vaccination Black dots indicate individuals who had SARS-CoV-2 infection after a booster dose. The graph indicates the Spearman correlation coefficient with 95% CI.

