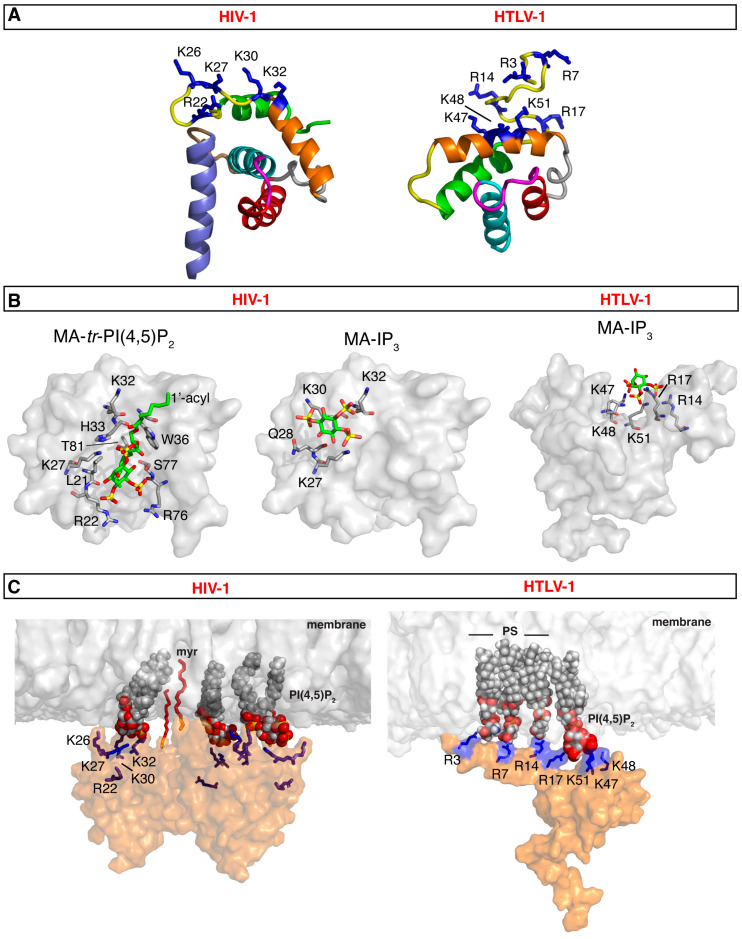
Figure 3.
MA-membrane binding models for HIV-1 and HTLV-1. (A) Structures of HIV-1 myrMA (PDB code 2H3I) and HTLV-1 myr(–)MA (PDB code 7M1W). Structures highlight the HBR implicated in membrane binding (blue sticks). For HIV-1 myrMA, the following residues are not shown for clarity: myr group, residues 2–3 and 115–132. For HTLV-1 myr(–)MA, the following residues are not shown for clarity: 1–2 and 94–99. (B) Surface representation of the HIV-1 myrMA structure (PDB code 2H3I) highlighting residues that exhibited substantial chemical shift changes upon binding of tr-P(4,5)P2 (PDB code 2H3V) and IP3 (left and middle, respectively). Structures are viewed in identical orientations. The structure of HTLV-1 myr(–)MA bound to IP3 is shown on the right. (C) Models of HIV-1 myrMA and HTLV-1 myr(–)MA bound to membrane showing interactions between PI(4,5)P2 and/or PS and the HBR. Membrane bilayer was constructed by CHARMM-GUI [169].

