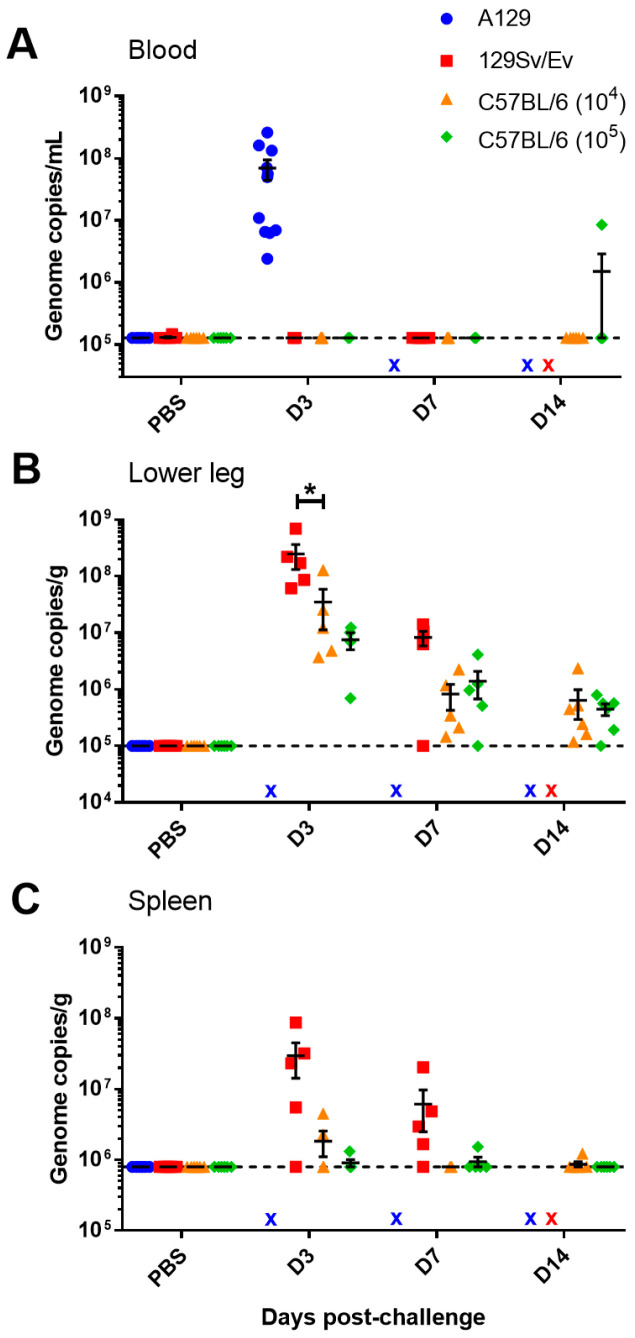
Figure 3.
Viral RNA levels in blood and tissues from CHIKV-challenged mice measured by RT-PCR. Levels in the (A) blood expressed as genome copies per mL, and levels in the (B) lower hindlimb and (C) spleen expressed as genome copies per g. x, indicates samples not available. *, p < 0.05. Symbols show results from individual animals with line and whisker plots denoting mean and standard error.

