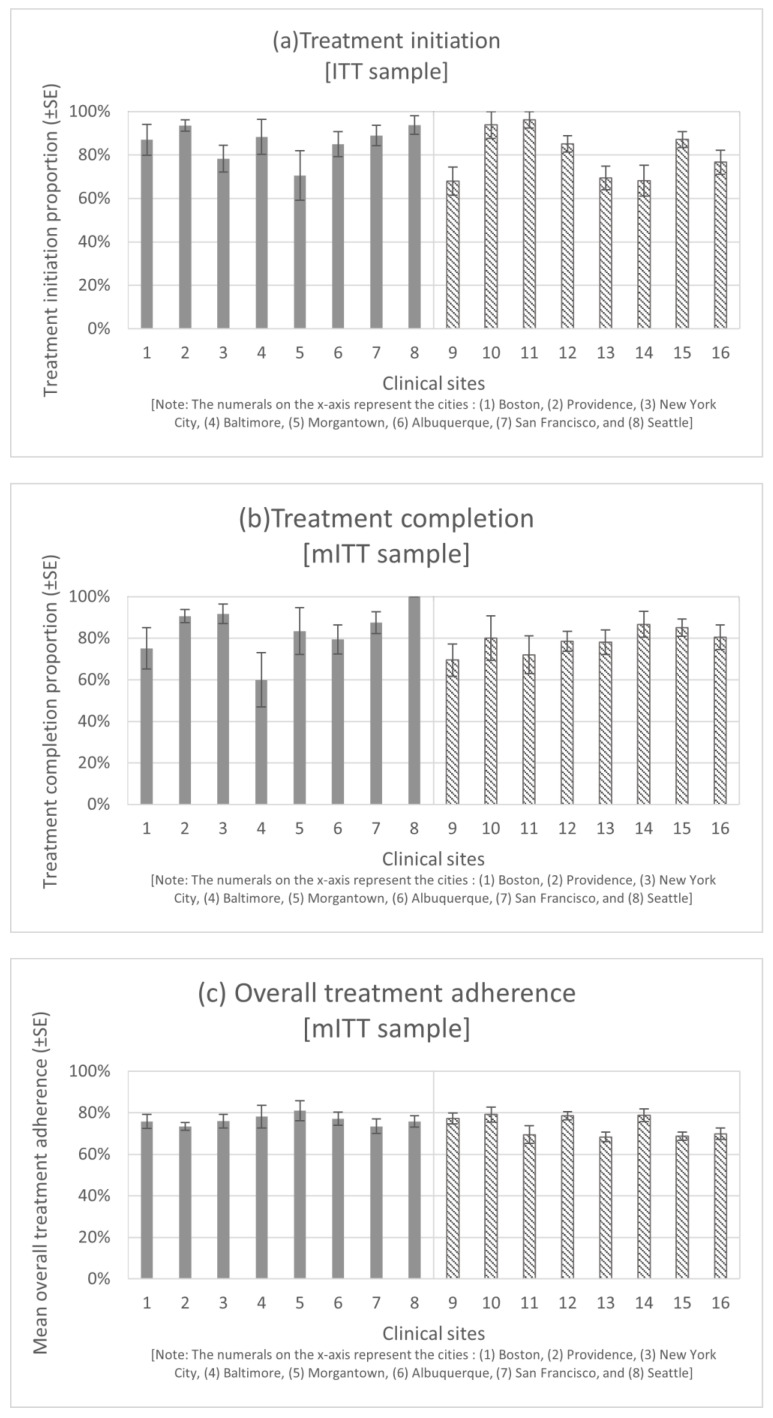
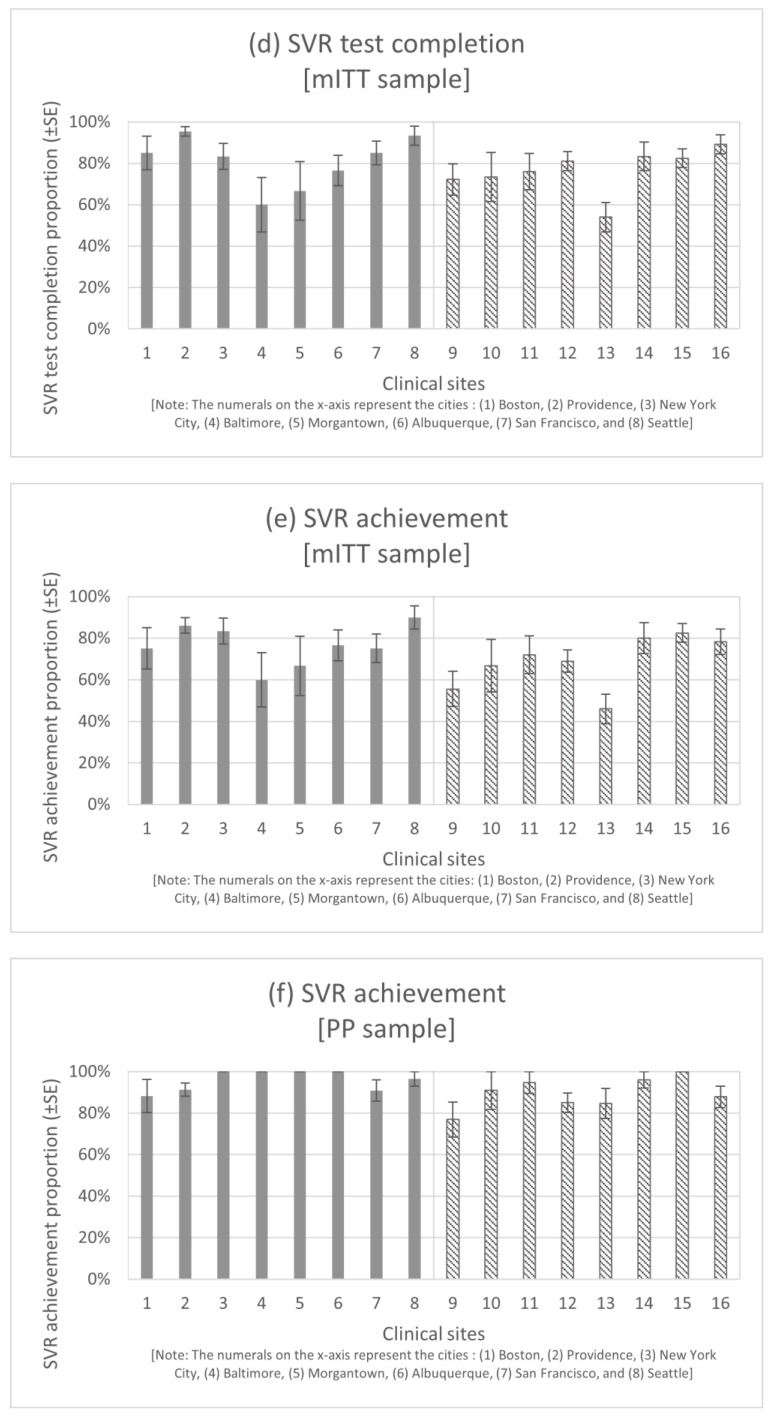
Figure 1.
Distribution of the study outcomes by clinical sites. The bars in the charts indicate the outcomes within each of the 16 clinical sites. The error bars are for standard errors (SE). The numerals on the x-axis represent the cities where the OTP/CHC sites were located as follows: (1) Boston, (2) Providence, (3) New York City, (4) Baltimore, (5) Morgantown, (6) Albuquerque, (7) San Francisco, and (8) Seattle. Grey and striped bars have been used to distinguish between the OTP and CHC sites. Abbreviations: intention-to-treat (ITT), modified intention-to-treat (mITT), per-protocol (PP), opioid treatment program (OTP), community health center (CHC); sustained virologic response (SVR).


