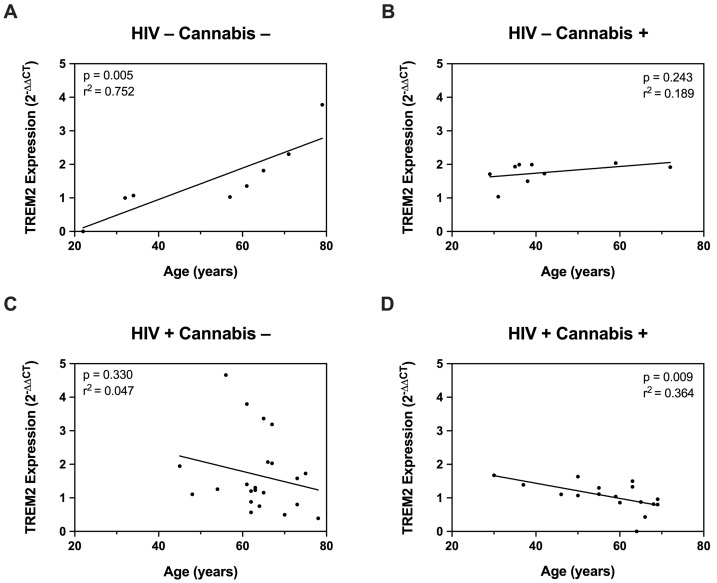
Figure 4.
The relationship TREM2 and age is differentially affected by cannabis and HIV. (A) Correlation plot for TREM2 expression in MDMs versus age in PWoH with no cannabis use (n = 8). (B) Correlation plot for TREM2 expression in MDMs versus age in PWoH that use cannabis. (n = 9). (C) Correlation plot for TREM2 expression in MDMs versus age in PWH with no cannabis use (n = 22). (D) Correlation plot for TREM2 expression in MDMs versus age in PWH that use cannabis (n = 17). Data presented as mean ± SEM relative fold change in TREM2 using the comparative CT method (2−ΔΔCq) and normalized to ACTB. Each point represents individual expression values in MDMs collected from unique donors. All correlation plots analyzed via simple linear regression. Individual significance (p-value) and goodness of fit coefficient (r2) determined for each correlation and listed within plots. n = 8–22 per plot; statistical significance was determined at p < 0.05.

