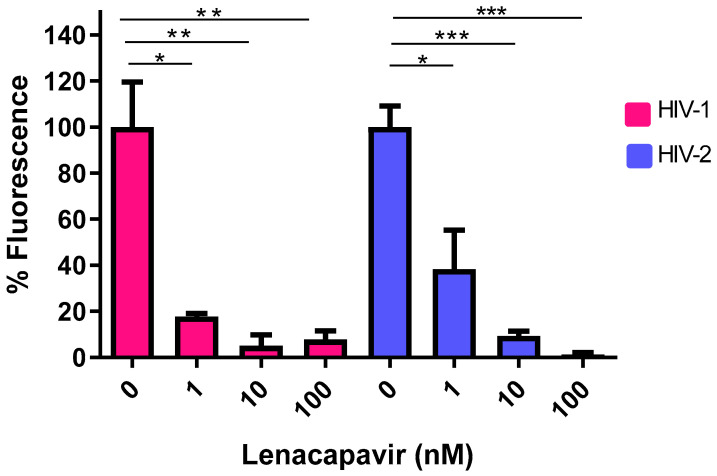
Figure 3.
HIV-1 and 2 pseudovirions with aberrant capsids produced in the presence of lenacapavir. Pseudovirions were produced in the presence of 1, 10, and 100 nM of lenacapavir. The y axis indicates percentage of transduction efficiency (percentage of fluorescence), and x axis denotes the concentrations of lenacapavir used to treat the cells. Control cells were only treated with DMSO. Results are concluded from triplicate measurements. * p value ≤ 0.05, ** p value ≤ 0.01, *** p value ≤ 0.001.

