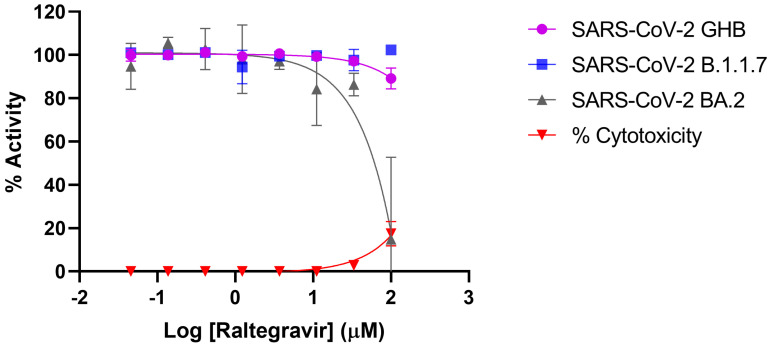
Figure 5.
Inhibition profiling of Raltegravir against SARS-CoV-2. Efficacy against the prototypical Wuhan-Hu-1 (GBH) is shown in purple, while that against the B.1.1.7 variant is shown in blue, and omicron BA.2 is shown in grey. Percentage of cytotoxicity is indicated in red. Inhibition profiling was carried out in Vero E6 cells and then confirmed in A549-Dual™ hACE2-TMPRSS2 cells. y axis indicates percentage of inhibition, and x axis is the logarithmic transformation of the inhibitor’s concentration. Results represent at least triplicate measurements.

