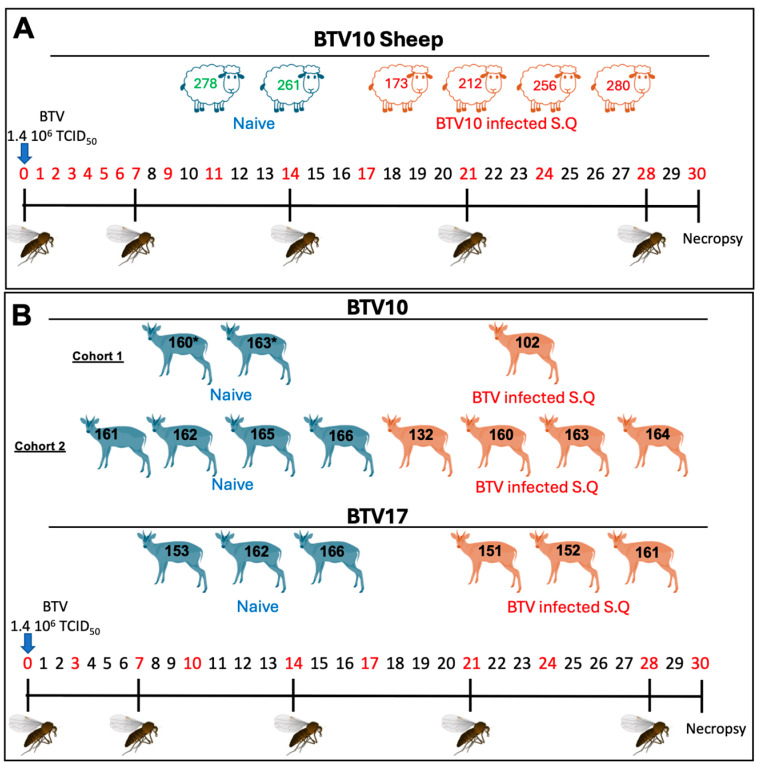
Figure 1.
Experimental study design. (A) Sheep and (B) muntjac deer are shown by representative drawings. Negative animals (shown in blue) and positive animals (shown in red) are divided into cohorts. Individual animal numbers were assigned for each experimental animal and indicated by a numerical overlay for each representative animal. At D0, animals were inoculated with BTV. The days denoted in red are those when blood draws occurred. The midge icon represents days on which naive midges were fed on the experimental animals. Animals with (*) after their number denote those used as negatives in the BTV10 study (non-terminal), which were subsequently incorporated as positively infected animals in a second experimental cohort.

