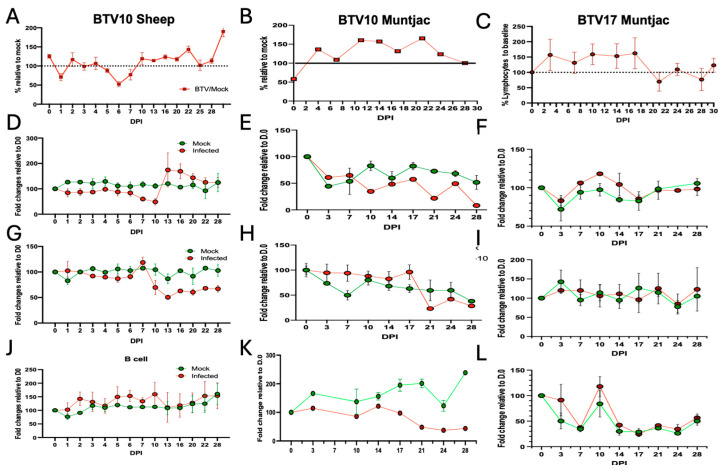
Figure 5.
Experimentally infected sheep and muntjac exhibited dynamic immune responses over the study time course. Peripheral blood was analyzed for specific cell subsets using flow cytometry and cell-specific antibodies. The data are presented with (left column) BTV10 sheep, (middle column) BTV10 in muntjac, and (right column) BTV17 in muntjac. Broader cell populations, as indicated by complete blood counts, show lymphocytes (A–C). CBC data are shown as BTV-infected relative to mock (set to 100%) for each timepoint. Specific cell populations were identified by flow cytometry (D–F) CD8+ T cells, (G–I) CD4+ T cells, (J–L) B cells were detected and evaluated. The data are shown as mock-infected (green) and BTV-infected (red). To account for animal-to-animal variation, all data points were standardized to signal at day 0.

