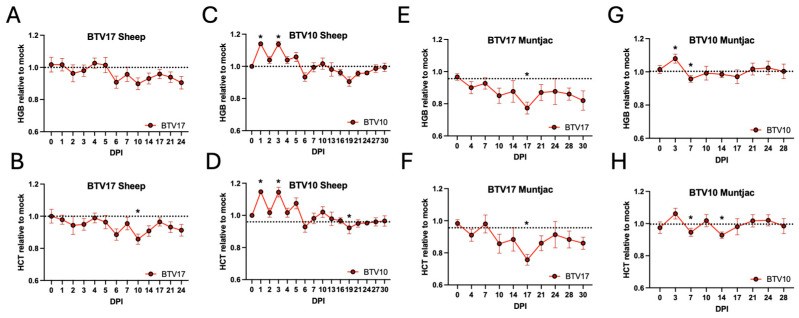
Figure 7.
Blood chemistry was performed on peripheral blood taken at each time point. The data are shown as the average of BTV-inoculated animals relative to the average mock-infected animals. Hemoglobin (top) and hematocrit (bottom) of (A,B) BTV17 sheep, (C,D) BTV10 sheep (E,F) BTV17 in muntjac, and (G,H) BTV10 in muntjac. To account for animal-to-animal variation, all data points were standardized to signal at day 0. * indicate statistical significance with a p-value of less than 0.05.

